IBM · Client: Truist · Cybersecurity dashboards

Truist Cyber Insights

I led UX for a suite of cybersecurity dashboards for Truist's CCS Data Intelligence team, turning thousands of compliance signals into views that executives, risk officers and SOC analysts could actually act on.
My roleUX lead & client-facing owner: requirements, wireframes, Tableau proofs of concept, stakeholder management
Timeframe2023 – 2026
PlatformTableau, on Truist's enterprise security data
AudienceCISO office, BISOs, DCIOs, SOC & CIRT analysts, risk teams
tableau · CCS Data Intelligence / CISO Operational
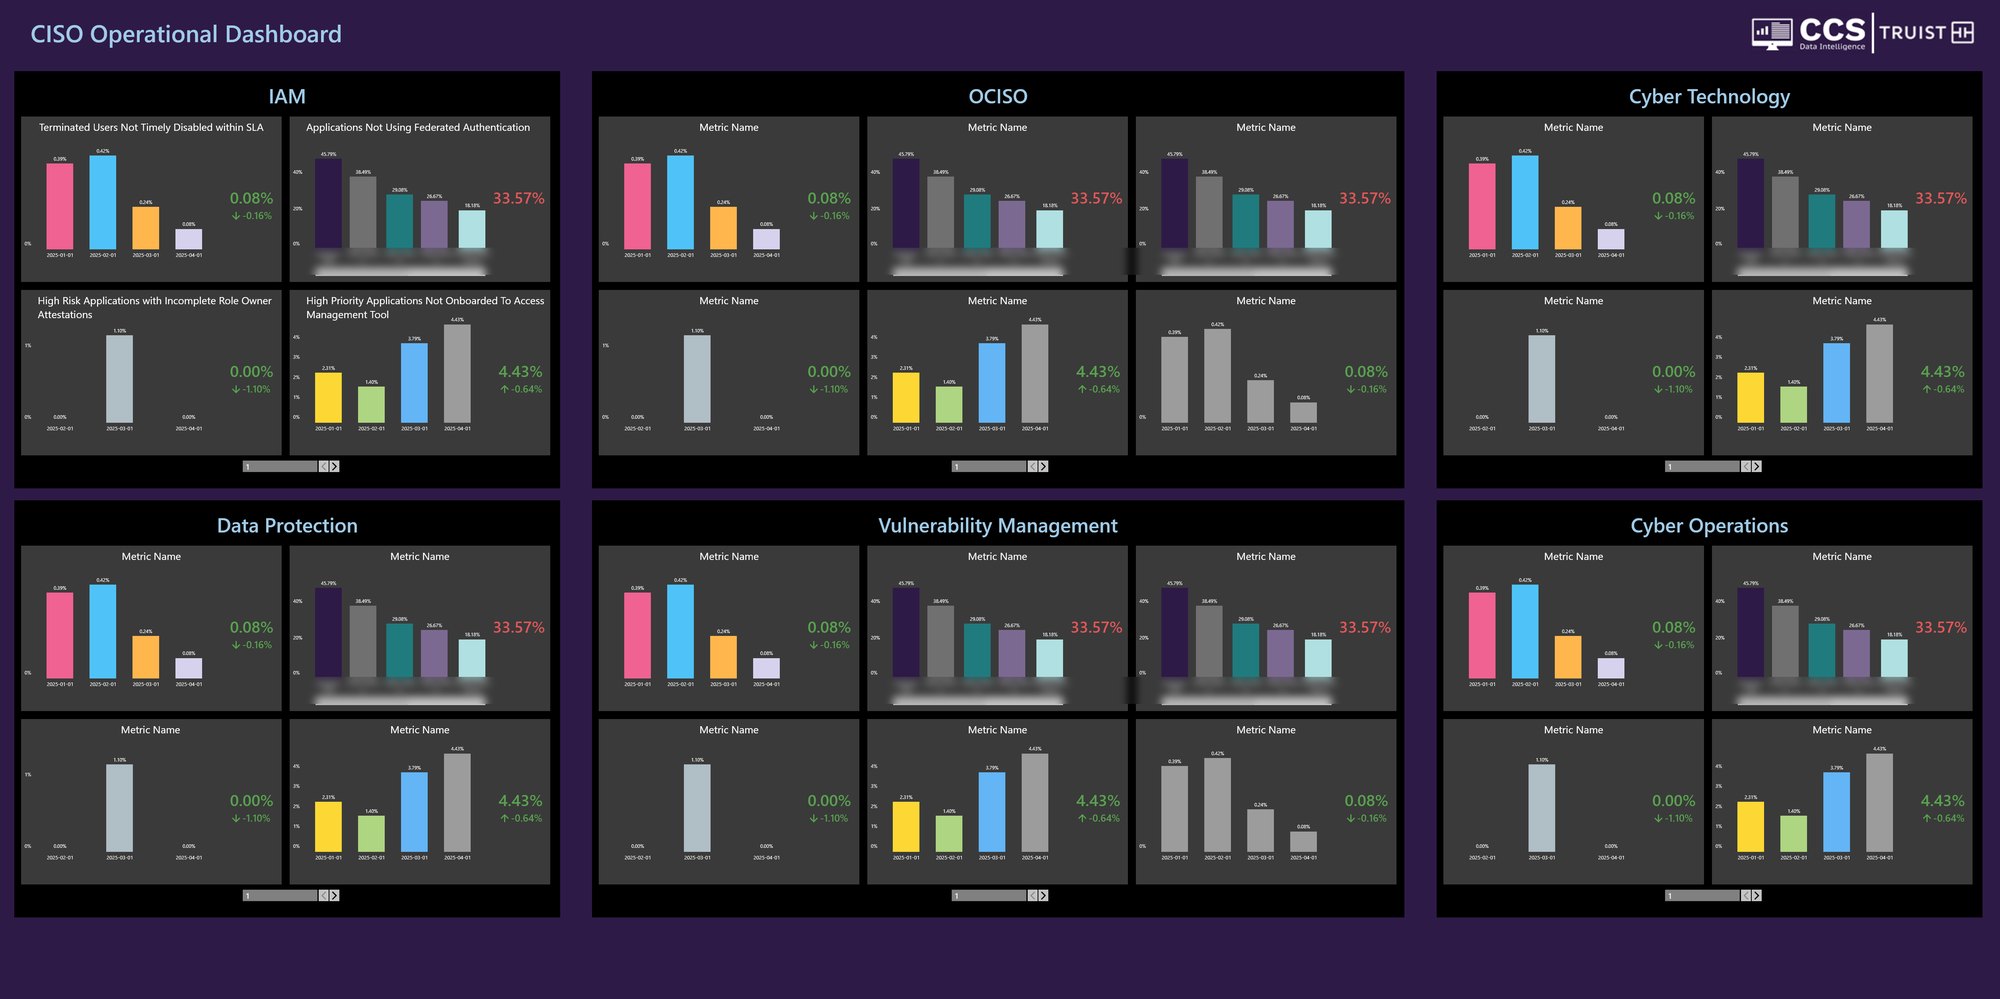
CISO Operational Dashboard with six security domains
NoteScreens are design-stage dashboards built on placeholder data (the XX values are intentional). Personal names that appeared in the mockups are blurred. Want to see how I'd redesign it? Switch to Redesign →
00Overview

Security data was everywhere. Answers weren't.

Truist's cyber teams tracked hundreds of metrics: endpoint coverage, scanning, privileged access, data loss prevention, incident response, resilience testing and more. The data lived in Tableau, fed by tools like ServiceNow, Veracode and Archer. But each team read it differently, and leaders couldn't see the big picture without asking someone to pull a report.

I was the UX lead on the IBM side. Much of my design work was proofs of concept showing that each dashboard could really be built in Tableau, where the data already lived. The other half of the job was people: working directly with Truist stakeholders to lock requirements, keep reviews moving and get every dashboard to engineering on time and complete.

140+wireframes and dashboard views designed across the program
20%faster incident response once SOC views were in place
50%fewer inconsistencies across dashboards, thanks to one shared template
25%faster dashboard iteration
25%shorter redesign timelines
35%higher user satisfaction
30%increase in phishing reporting
01The challenge

Many audiences, many metrics, one source of truth.

A CISO wants to know where the bank is exposed this month. A BISO wants to know which of their applications are failing. A SOC analyst wants to know how fast threats are being caught. Same data, very different questions.

01 / Scattered

Every metric, its own report

Teams built one-off views, so the same number could look different depending on who made the dashboard.

02 / Accountability

Hard to see who owns what

Compliance only moves when people know it's theirs. Owners (BISO, DCIO, BISM, business unit) weren't easy to filter to.

03 / Feasibility

Would it work in Tableau?

Ideas had to be buildable on the existing Tableau stack and real data model, not just look good in a mockup.

Objective

Give every audience a dashboard that answers their question in seconds, built from one consistent system that engineers can ship in Tableau.

How might we

How might we turn hundreds of security metrics into clear signals that show what's out of compliance, who owns it and what's coming due?

02Approach

Design the dashboard. Prove it in Tableau. Ship it.

My job sat between the client and the build team. I ran requirements with Truist, turned them into wireframes, proved each one could be built in Tableau, then handed engineers a spec they could build without guessing.

Stakeholder lead

Worked directly with Truist's cyber and risk leaders to set priorities, lock requirements and keep reviews on schedule.

Proofs of concept

Built dashboards as Tableau-ready designs, using real fields and filters, so every idea was proven buildable before engineering started.

One reusable system

A shared layout, filter rail, color logic and header meant new metrics dropped into a familiar shape. That cut inconsistencies in half.

ExecutiveCISO office

Posture across domains, what's out of compliance and for how long.

Risk ownersBISOs & DCIOs

Their applications, their gaps, filtered to their name.

OperationsSOC & CIRT

Case volume, closure rate, and time to detect and contain.

GovernanceRisk & controls

Processes, risks, controls, findings and remediation in one chain.

01
Intake

Metric, owner and audience with Truist leads

02
Requirements

Fields, filters, goals and thresholds

03
Wireframes

Layout on the shared template

04
Tableau POC

Prove it works on the real data model

05
Review

Stakeholder sign-off, all requirements met

06
Hand-off

Engineers build to spec, on time

03The system

One template. Dozens of metrics.

Most metrics answer the same four questions: how bad is it, where is it, who owns it and is it getting better? So I designed one standard template that any metric could plug into. Teams stopped reinventing layouts, and leaders learned to read every dashboard the same way.
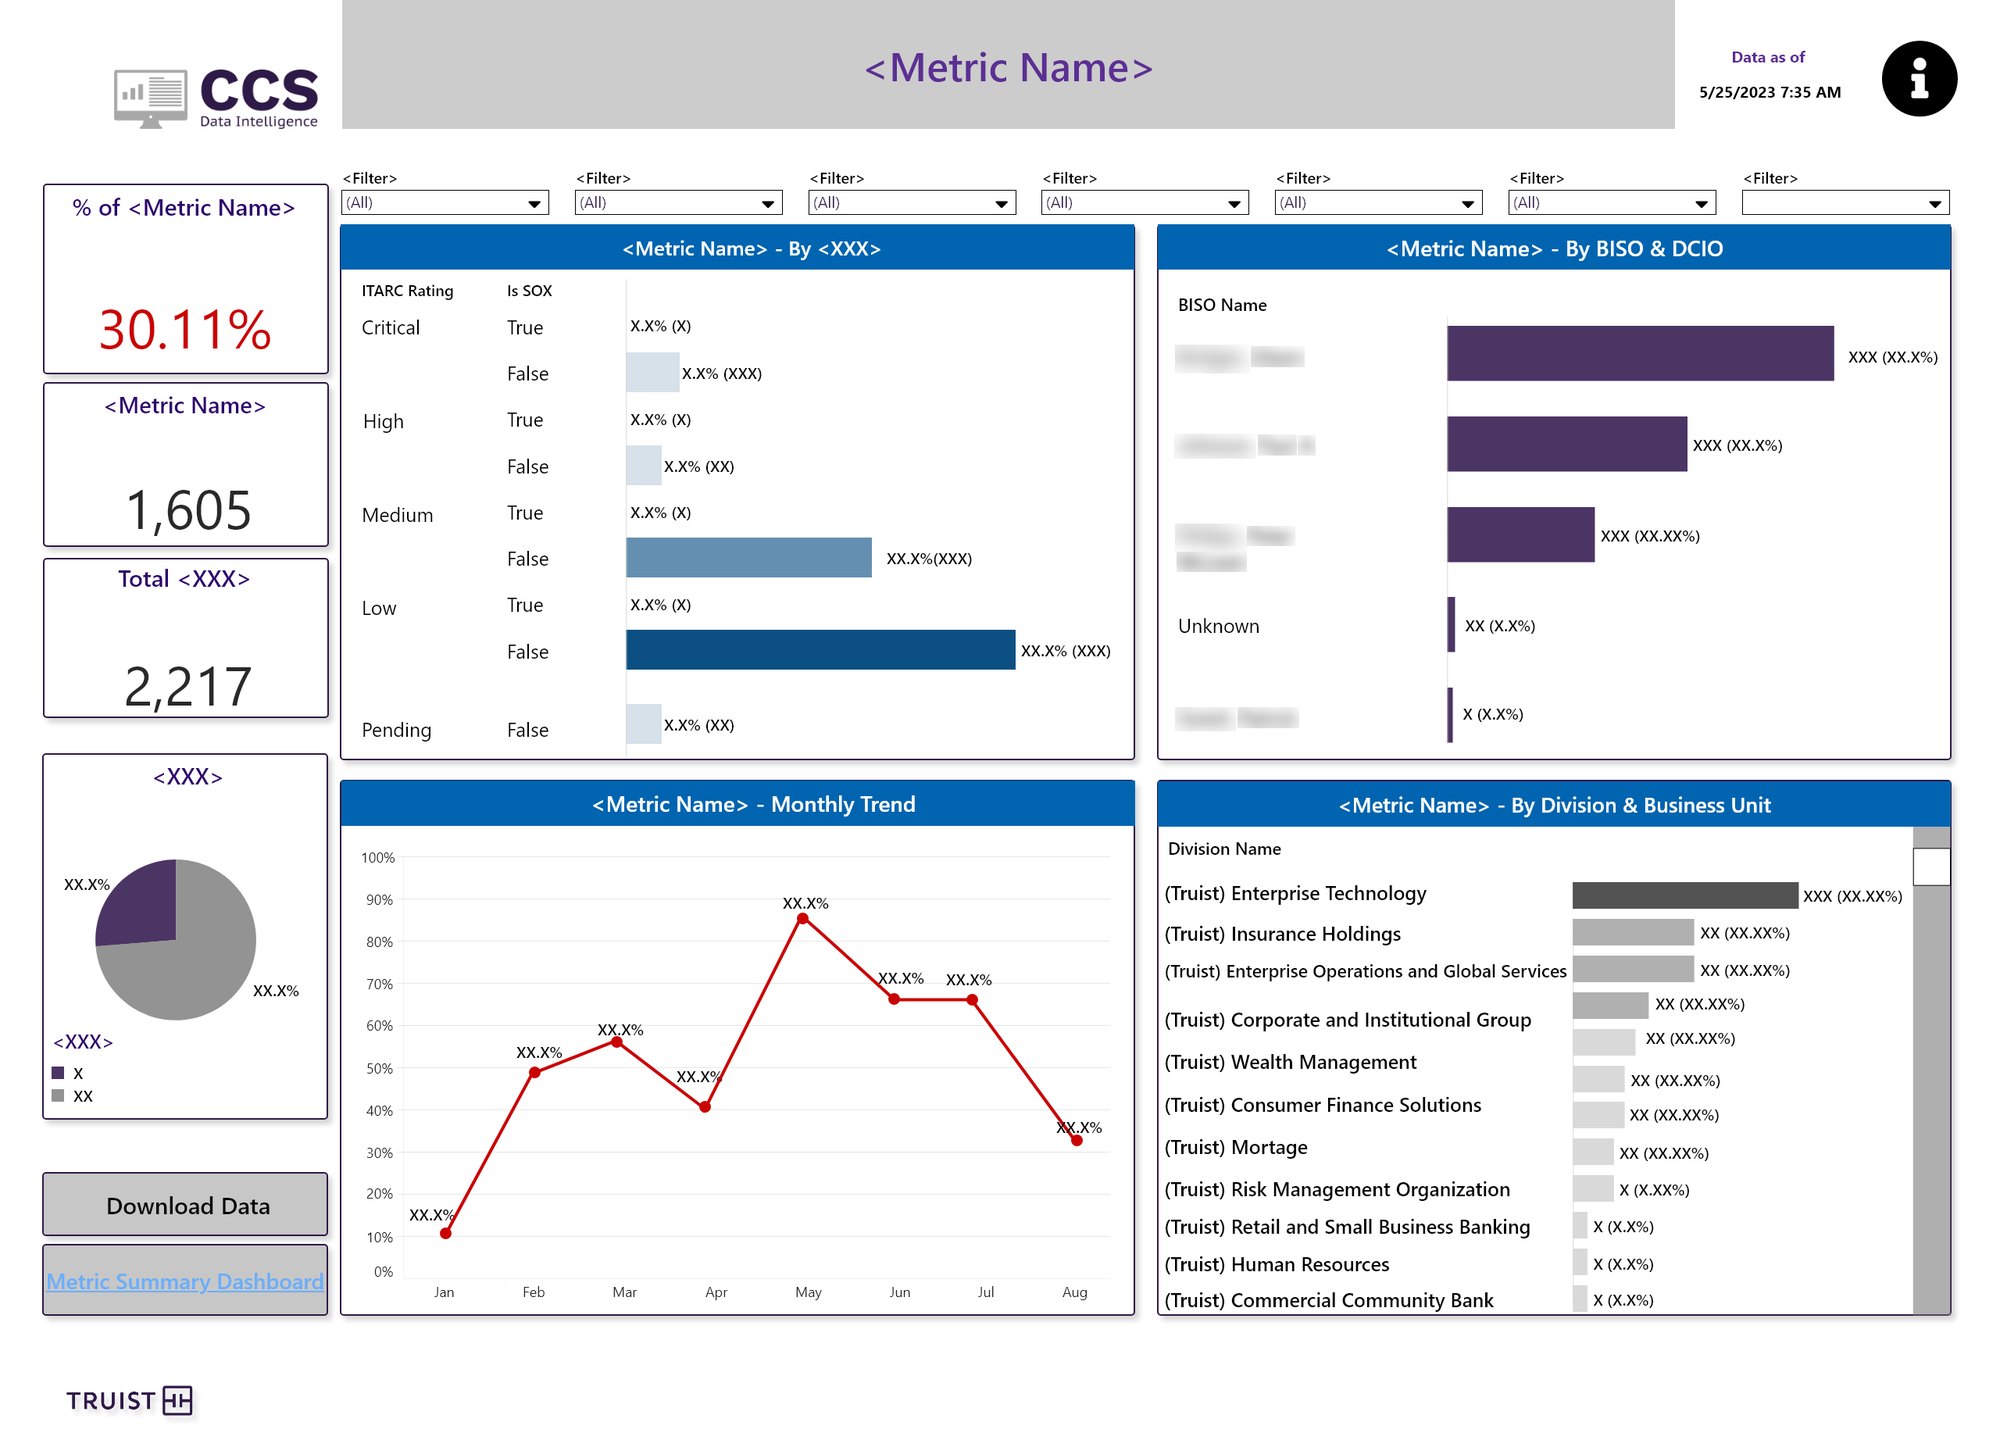
tableau · Standard Metric Template
  1. Headline numbersPercent and count on the left rail, readable at a glance.
  2. Filters on topSame order on every dashboard: owner, division, business unit, date.
  3. By risk ratingITARC rating and SOX flag show where the exposure matters most.
  4. By ownerBISO and DCIO bars make accountability visible.
  5. Trend + divisionMonthly trend and a breakdown by business unit close the loop.
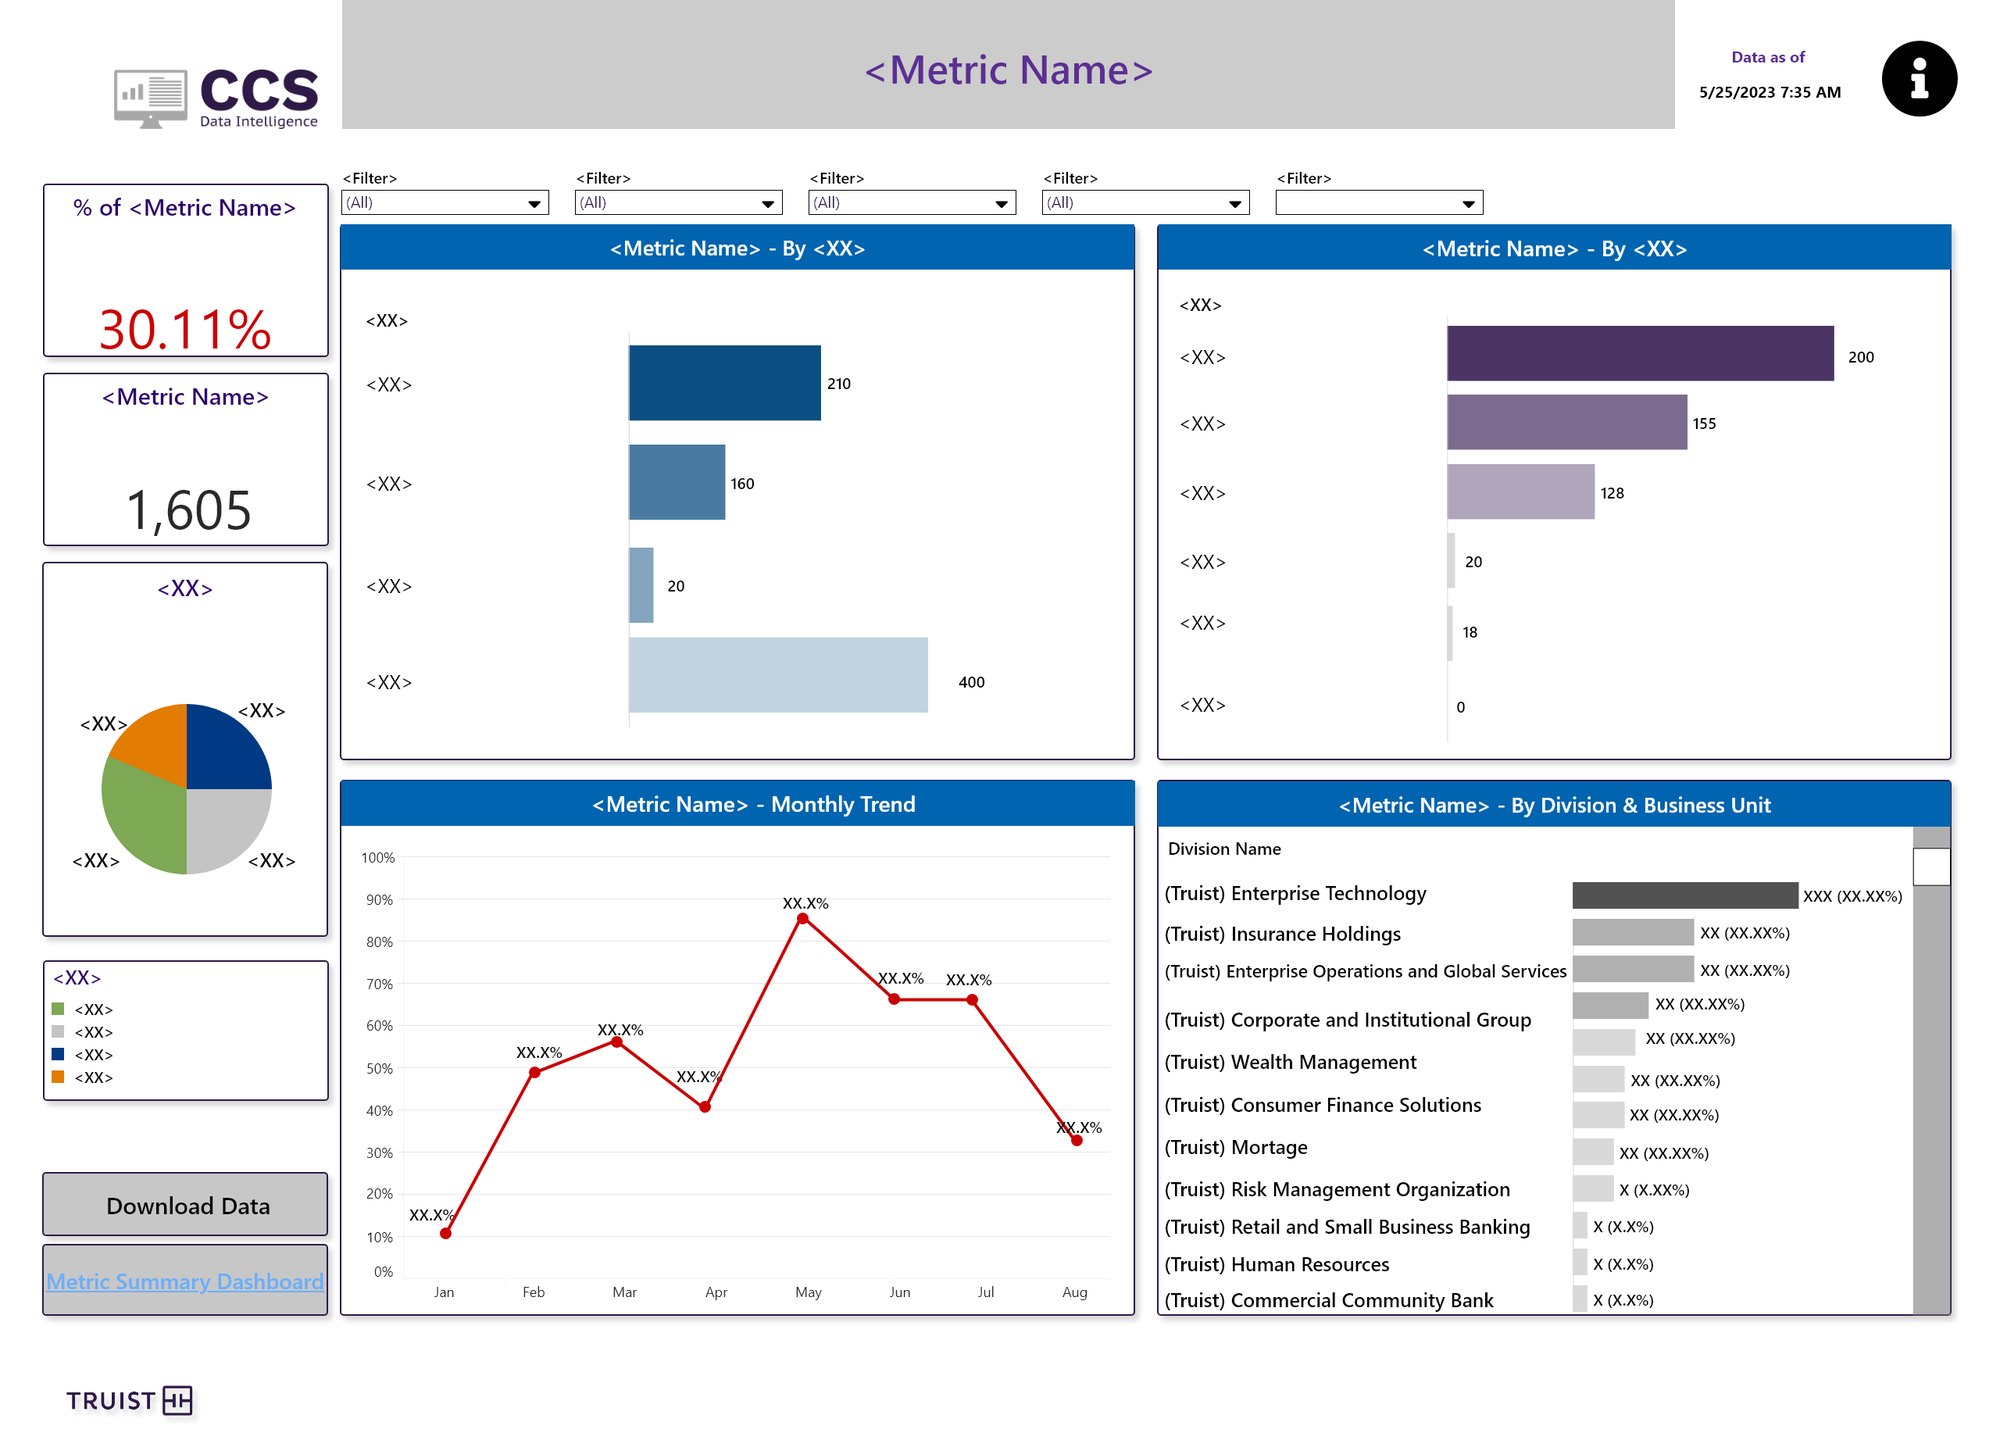
tableau · DLP Standard

The same template applied to a data loss prevention metric. Only the content changes.
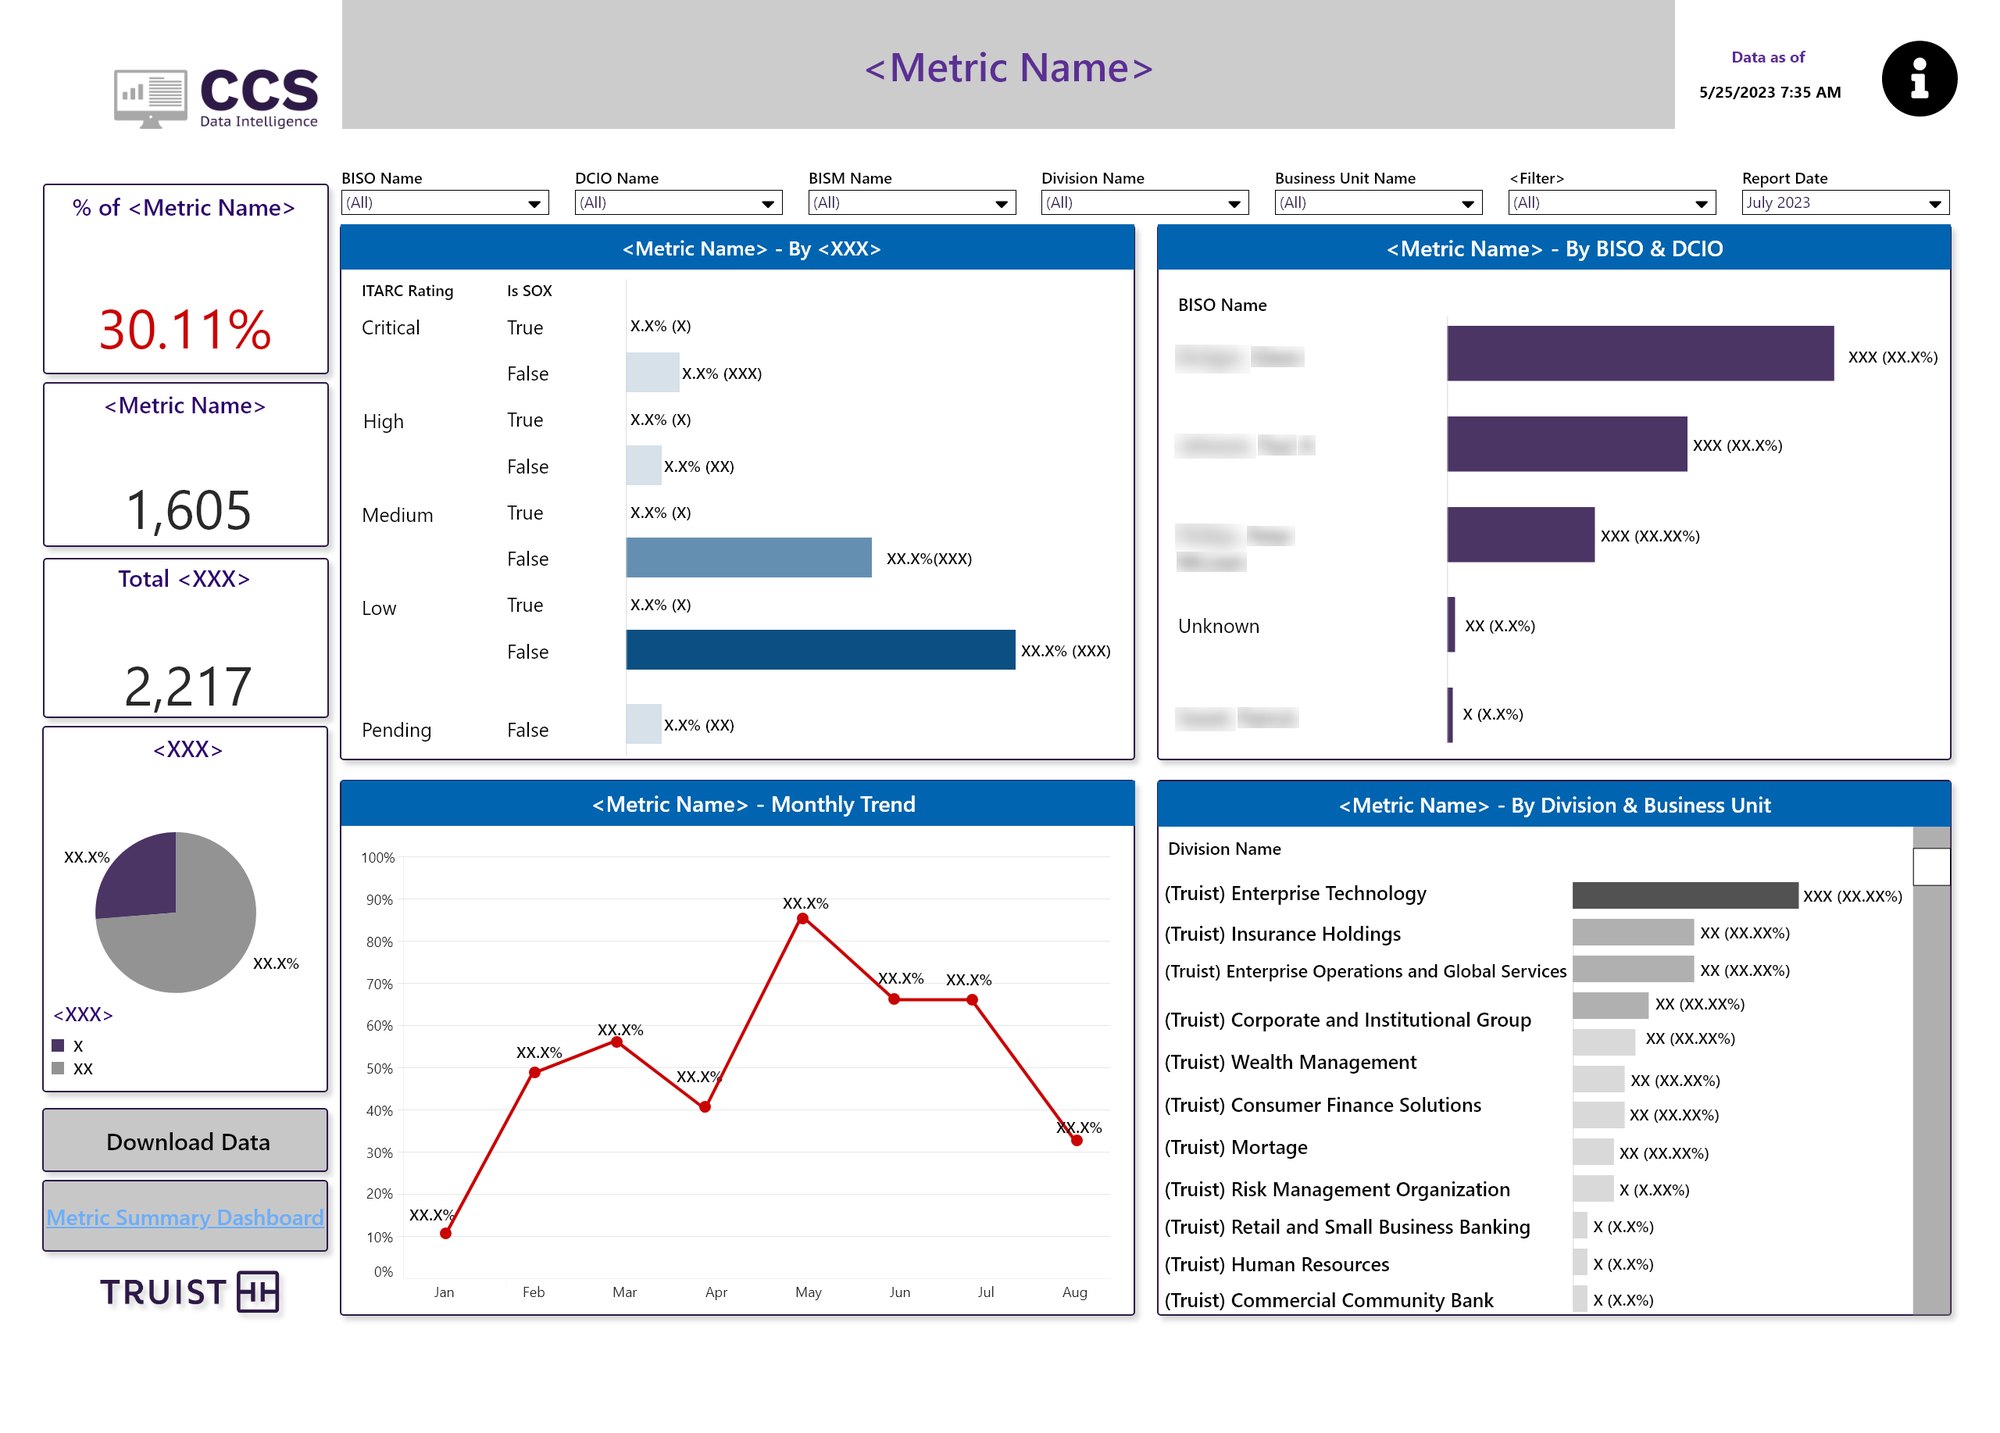
tableau · Metric report, July 2023

A report-date filter turns the live dashboard into a monthly snapshot for leadership reviews.

04The dashboards

From the CISO's desk to the SOC floor.

Each dashboard was built for one audience and one main question. Here's the suite, grouped by who uses it.

04.1 — Executive

Where are we exposed, right now?

The CISO Operational Dashboard puts six domains (IAM, OCISO, Cyber Technology, Data Protection, Vulnerability Management, Cyber Operations) on one screen. The CCS Metric Summary goes deeper: every metric, its goal, how long it's been out of compliance and how each business area is doing.

tableau · CISO Operational Dashboard

A dark, wall-screen friendly layout. Each domain shows its key metrics with the current value and the change since last month.
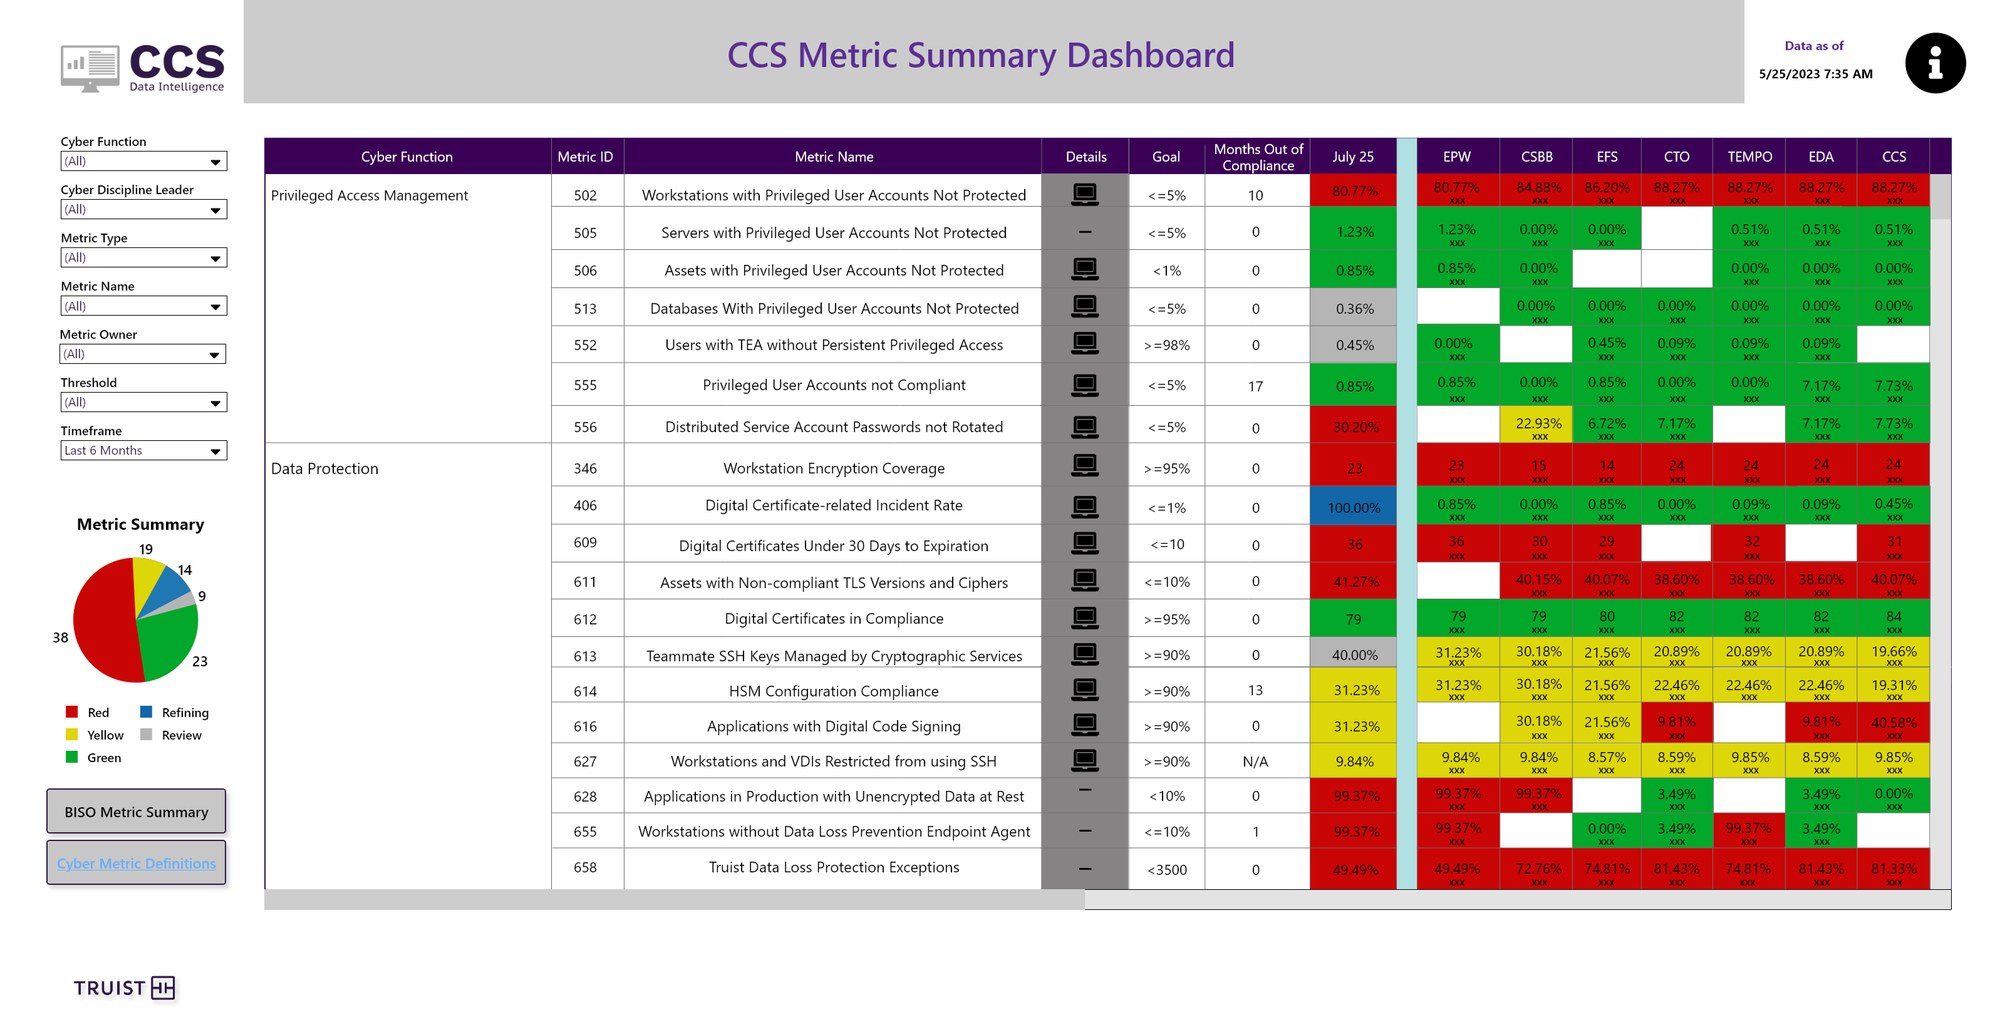
tableau · CCS Metric Summary

Red, yellow and green by business area, with "months out of compliance" so leaders can see what's been stuck the longest.

Domains, not data sources

Grouped the way the CISO's org is structured, so every leader finds their area immediately.

Change over time

Every number comes with its month-over-month change, so a value is never shown without context.

Duration matters

"Months out of compliance" turned a status into an escalation signal.

04.2 — Security operations

How fast are we catching threats?

The SOC & CIRT dashboard tracks case volume, closure rate and mean time to detect, acknowledge and contain. A dedicated Mean Time to Detect view breaks detection time into buckets and compares all events with confirmed true-positive incidents.
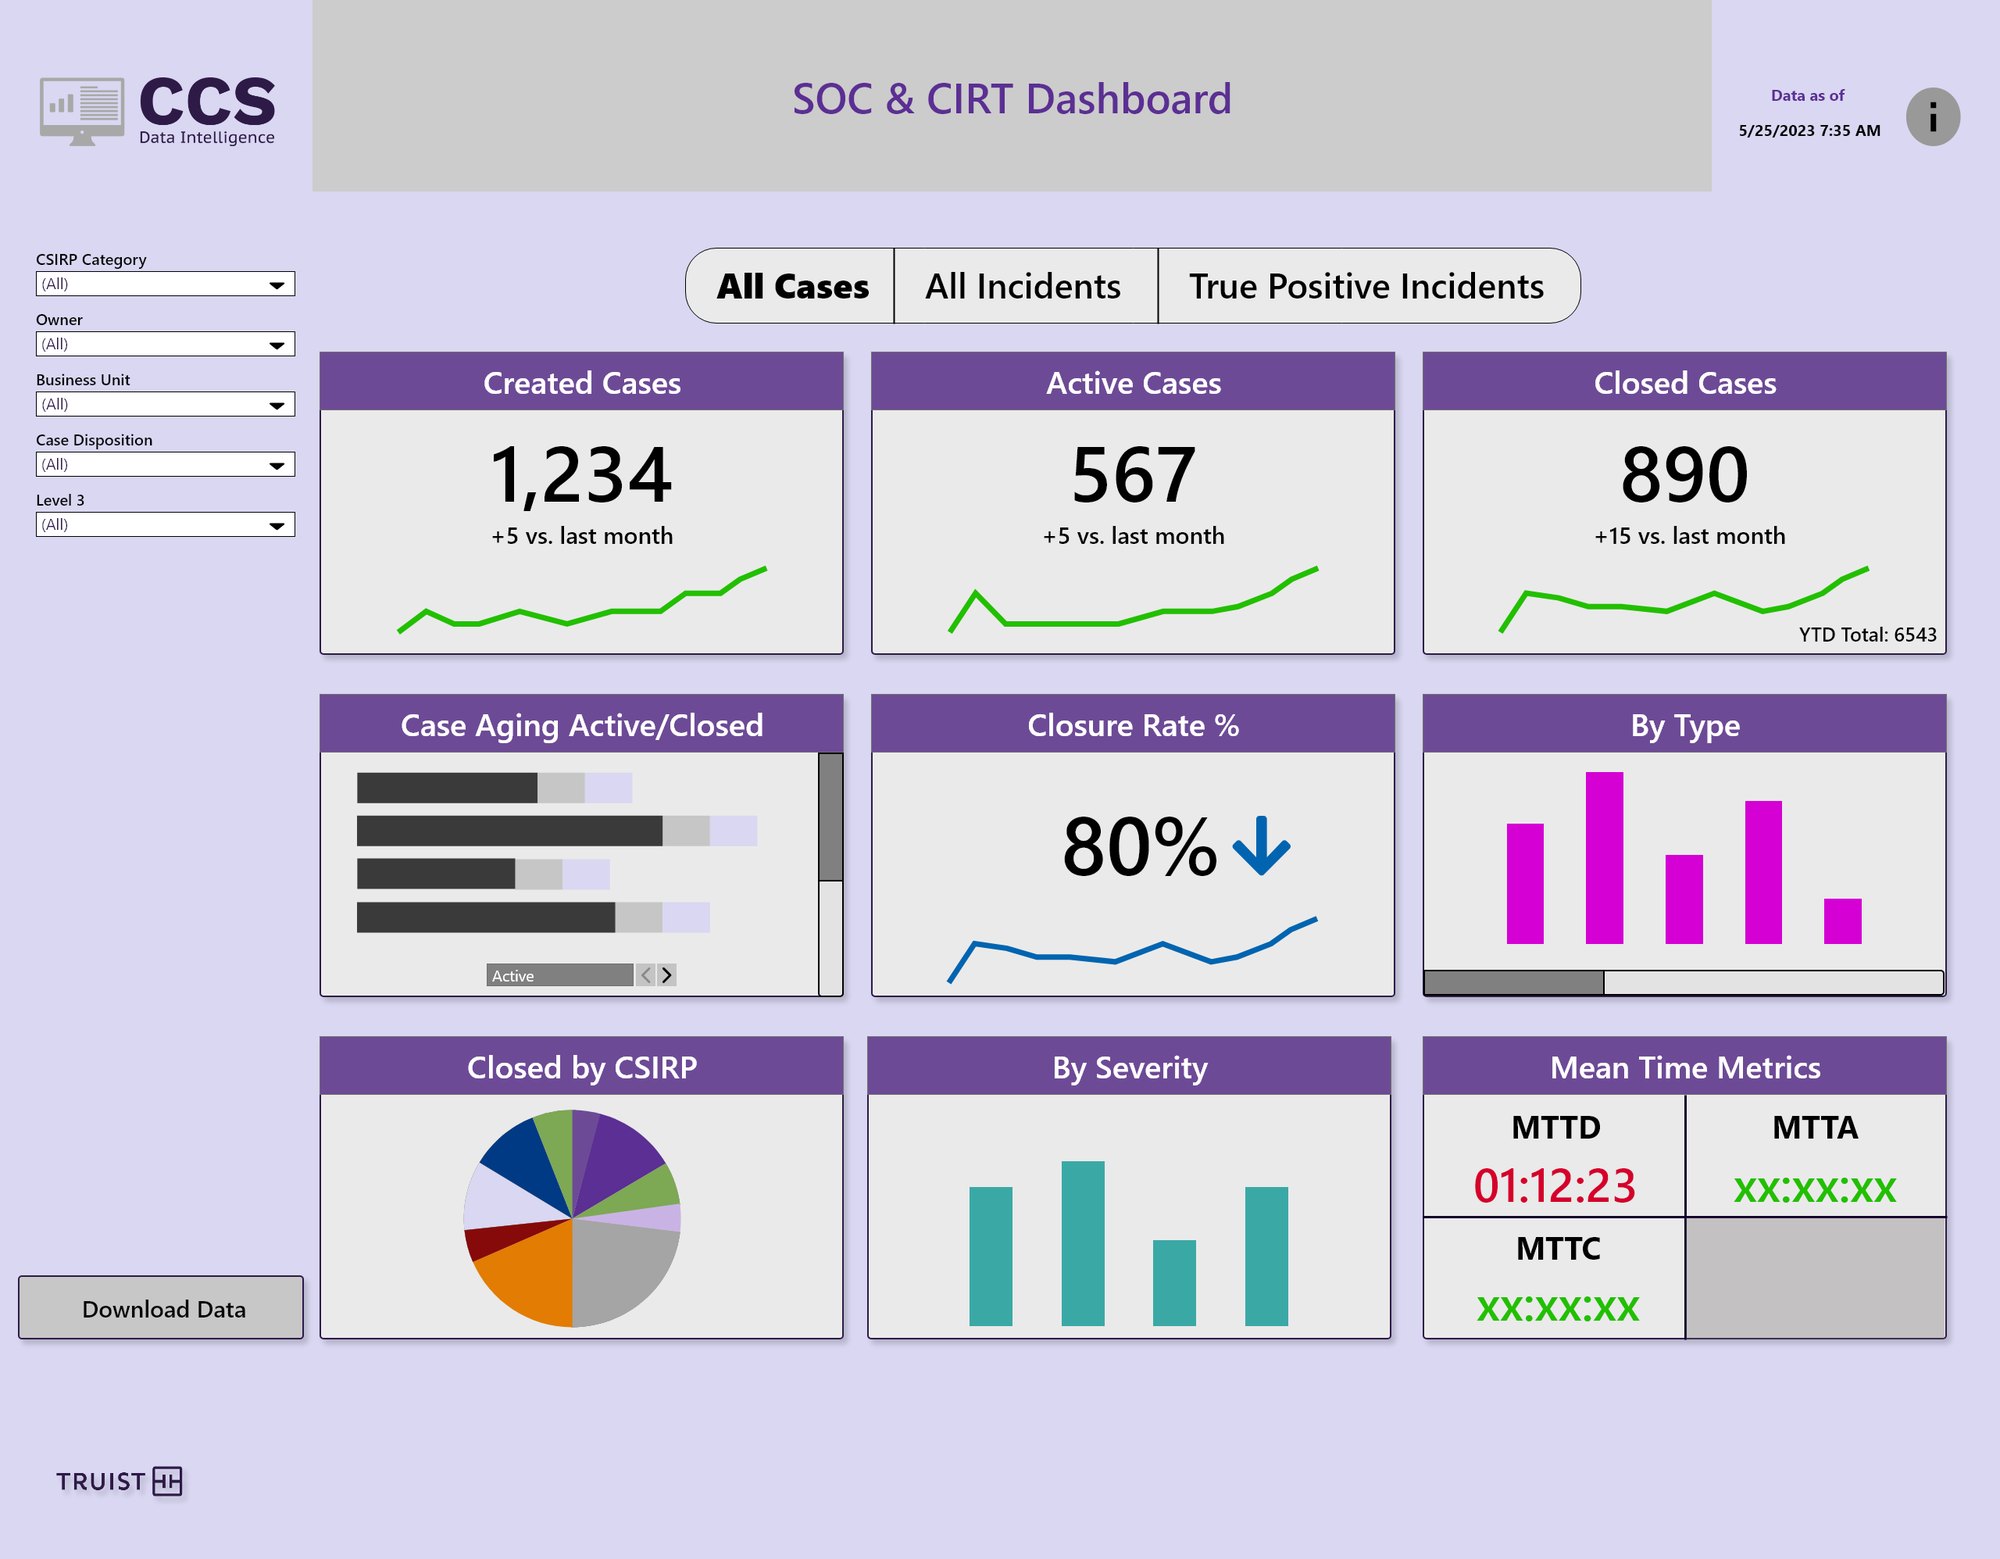
tableau · SOC & CIRT Dashboard

All cases, all incidents or true positives only, one toggle away.
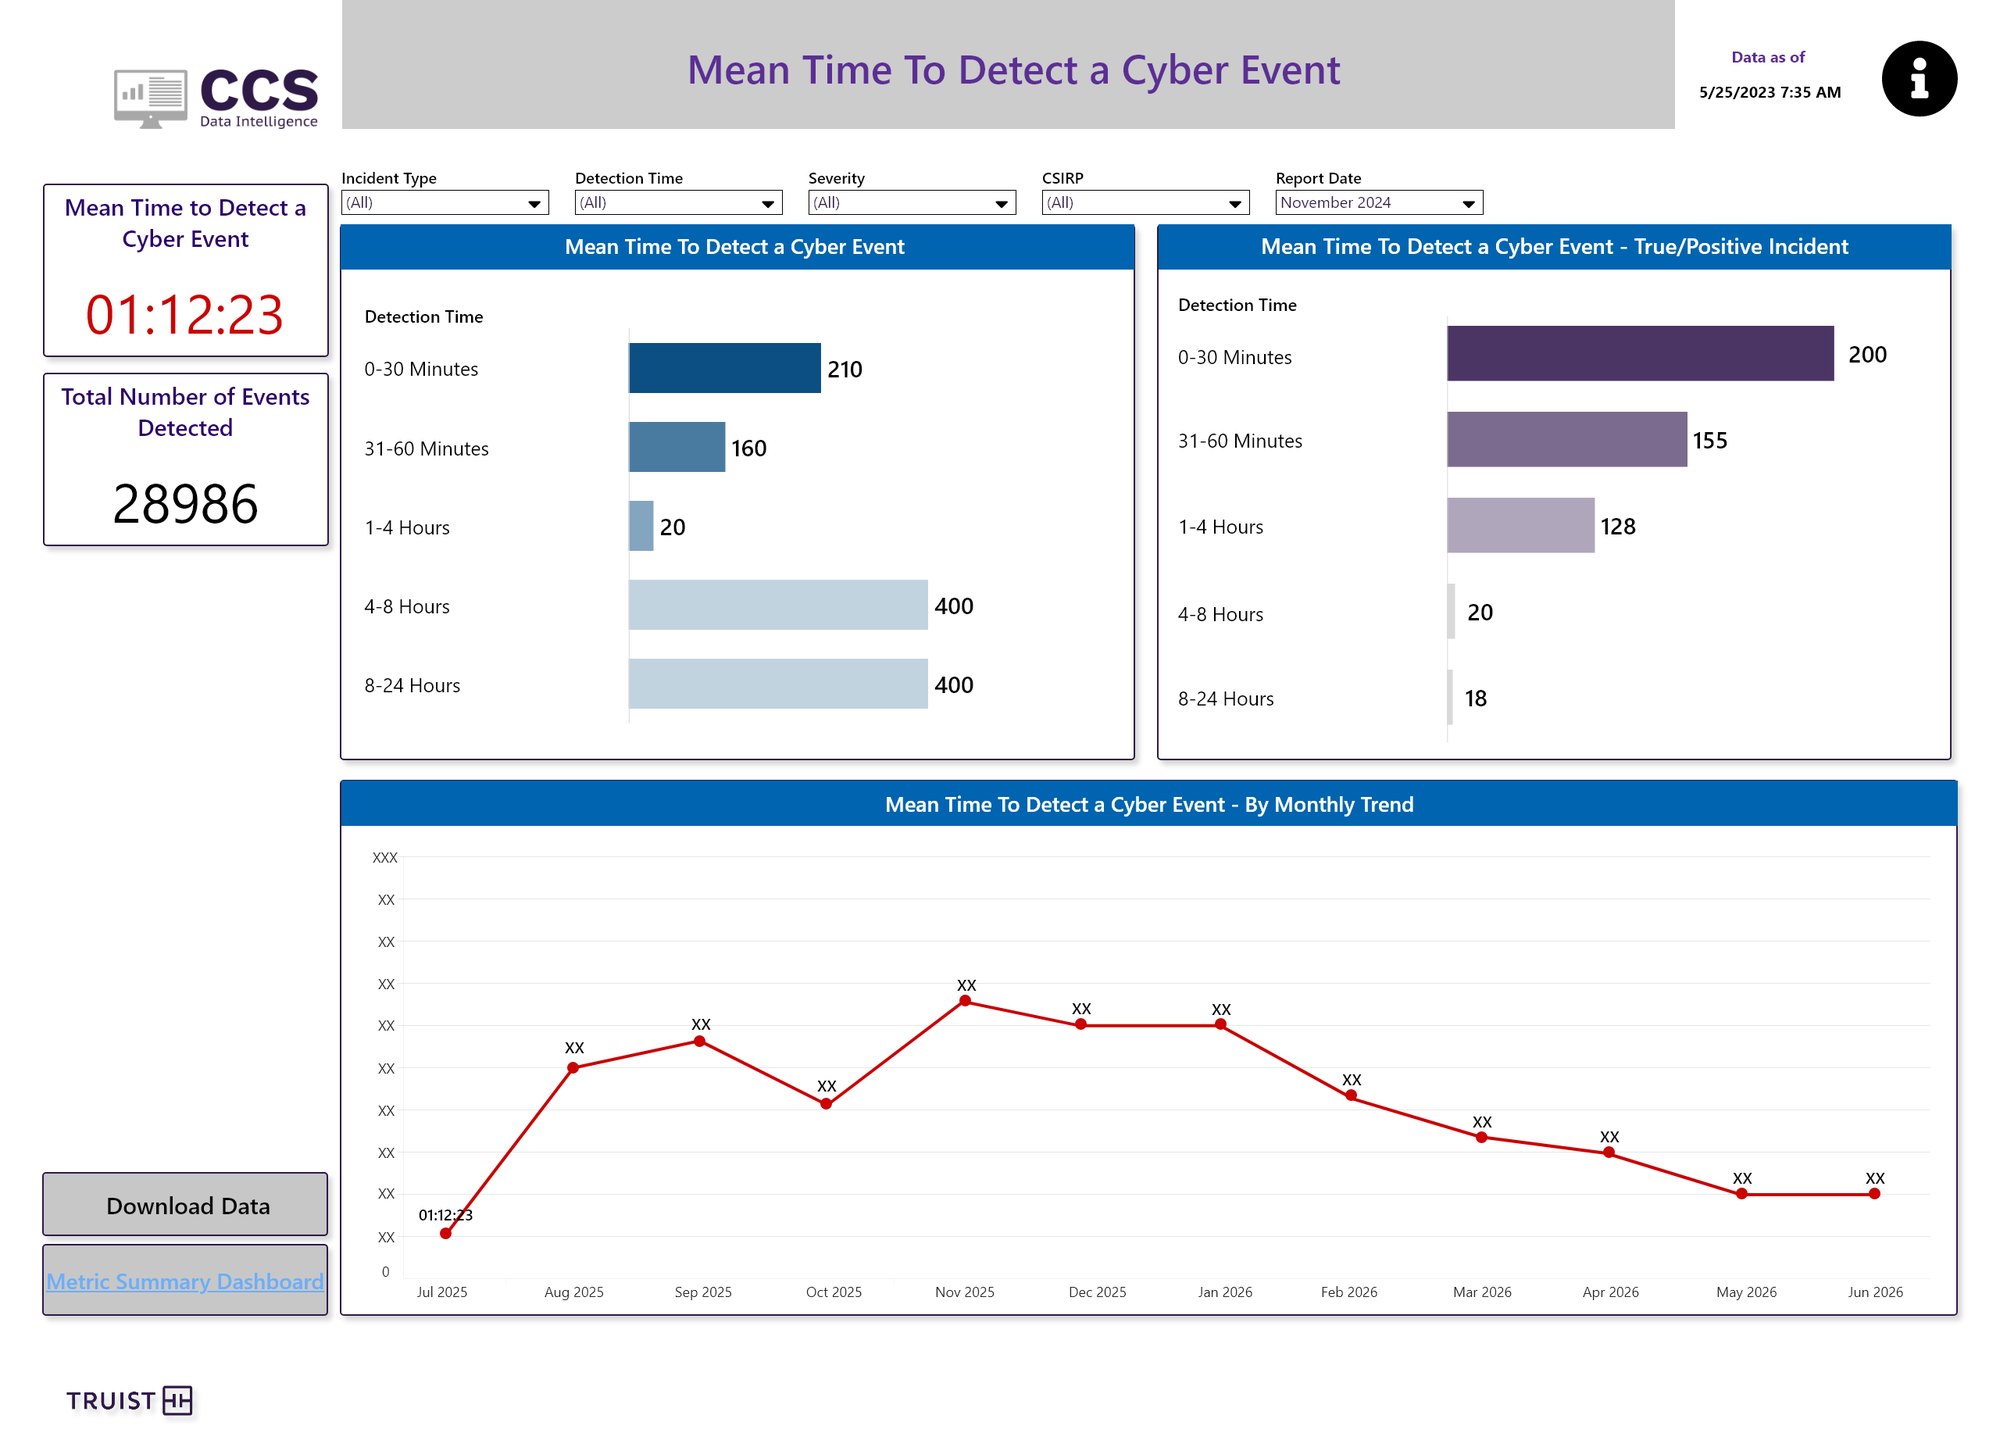
tableau · Mean Time To Detect a Cyber Event

Detection time buckets side by side for all events and true positives, plus a 12-month trend.

Big numbers first

Created, active and closed cases sit at the top with a sparkline and a monthly comparison.

True positives on their own

Separating real incidents from noise made response times honest.

Built for faster response

Teams could spot slow detection buckets quickly. Incident response got 20% faster.

04.3 — Coverage & compliance

Is every server and app protected?

Endpoint Coverage shows how many servers each security tool (Tanium, antivirus, CrowdStrike, SEP) covers, trended by risk rating. Application Compliance gives each app a single scorecard: 23 requirements, red or green, with plain-language definitions next to every one.
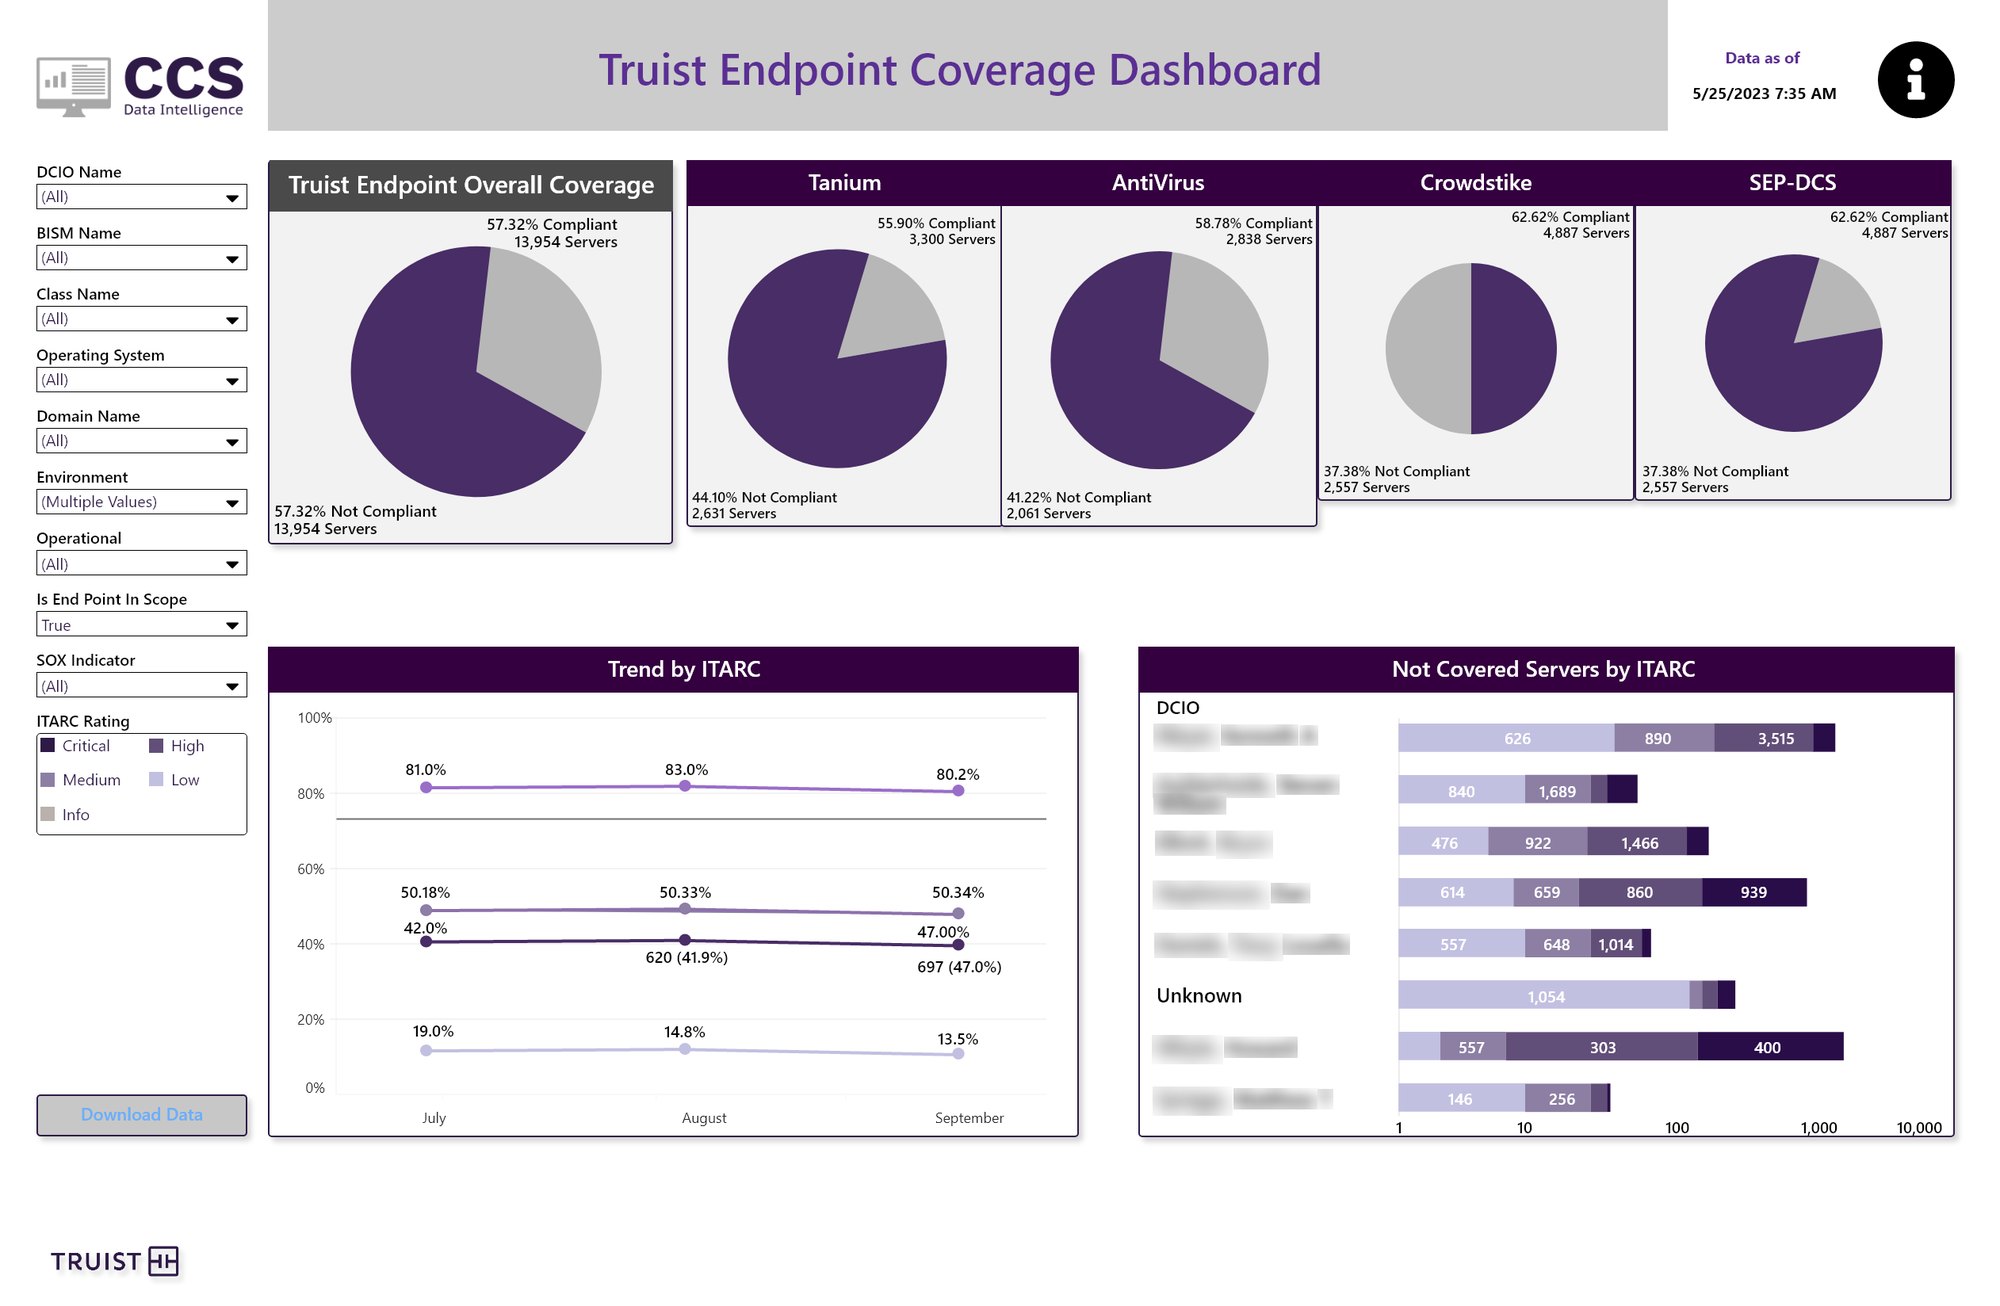
tableau · Truist Endpoint Coverage

Overall coverage, then one pie per tool. Not-covered servers are broken down by owner and risk rating.
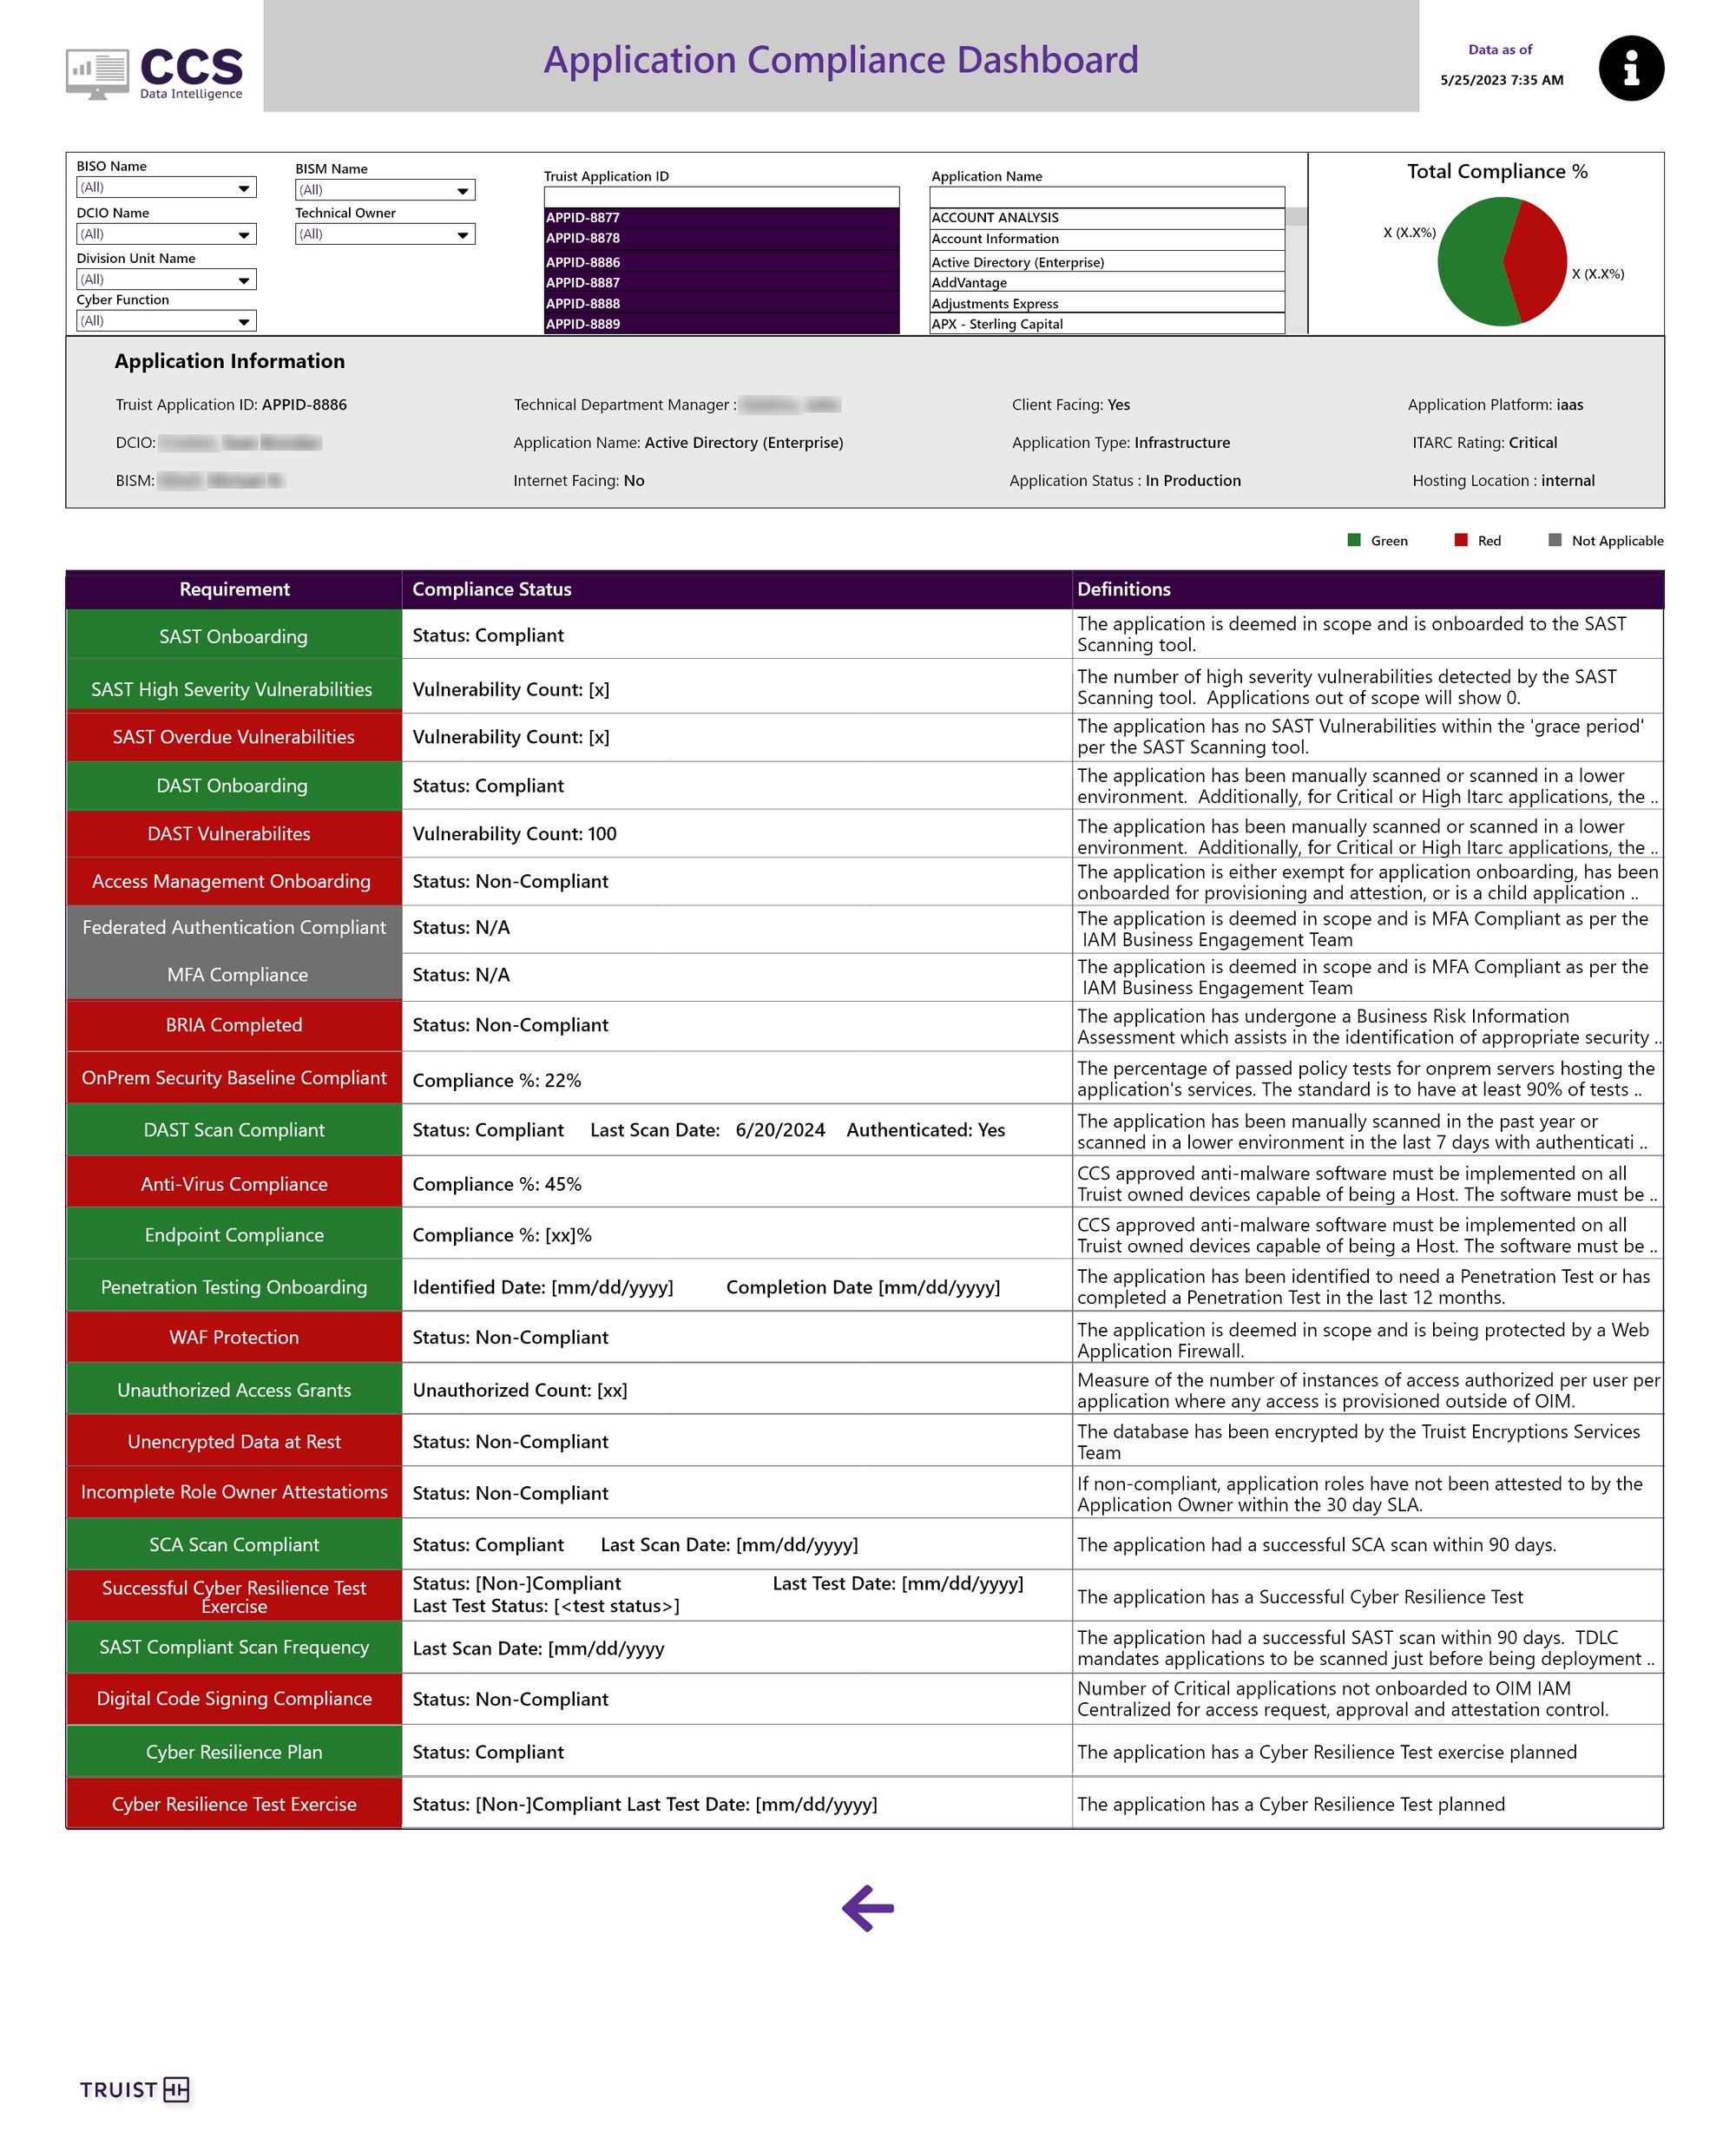
tableau · Application Compliance

Scroll inside the frame. Pick an app and every requirement shows its status, its value and what it means.
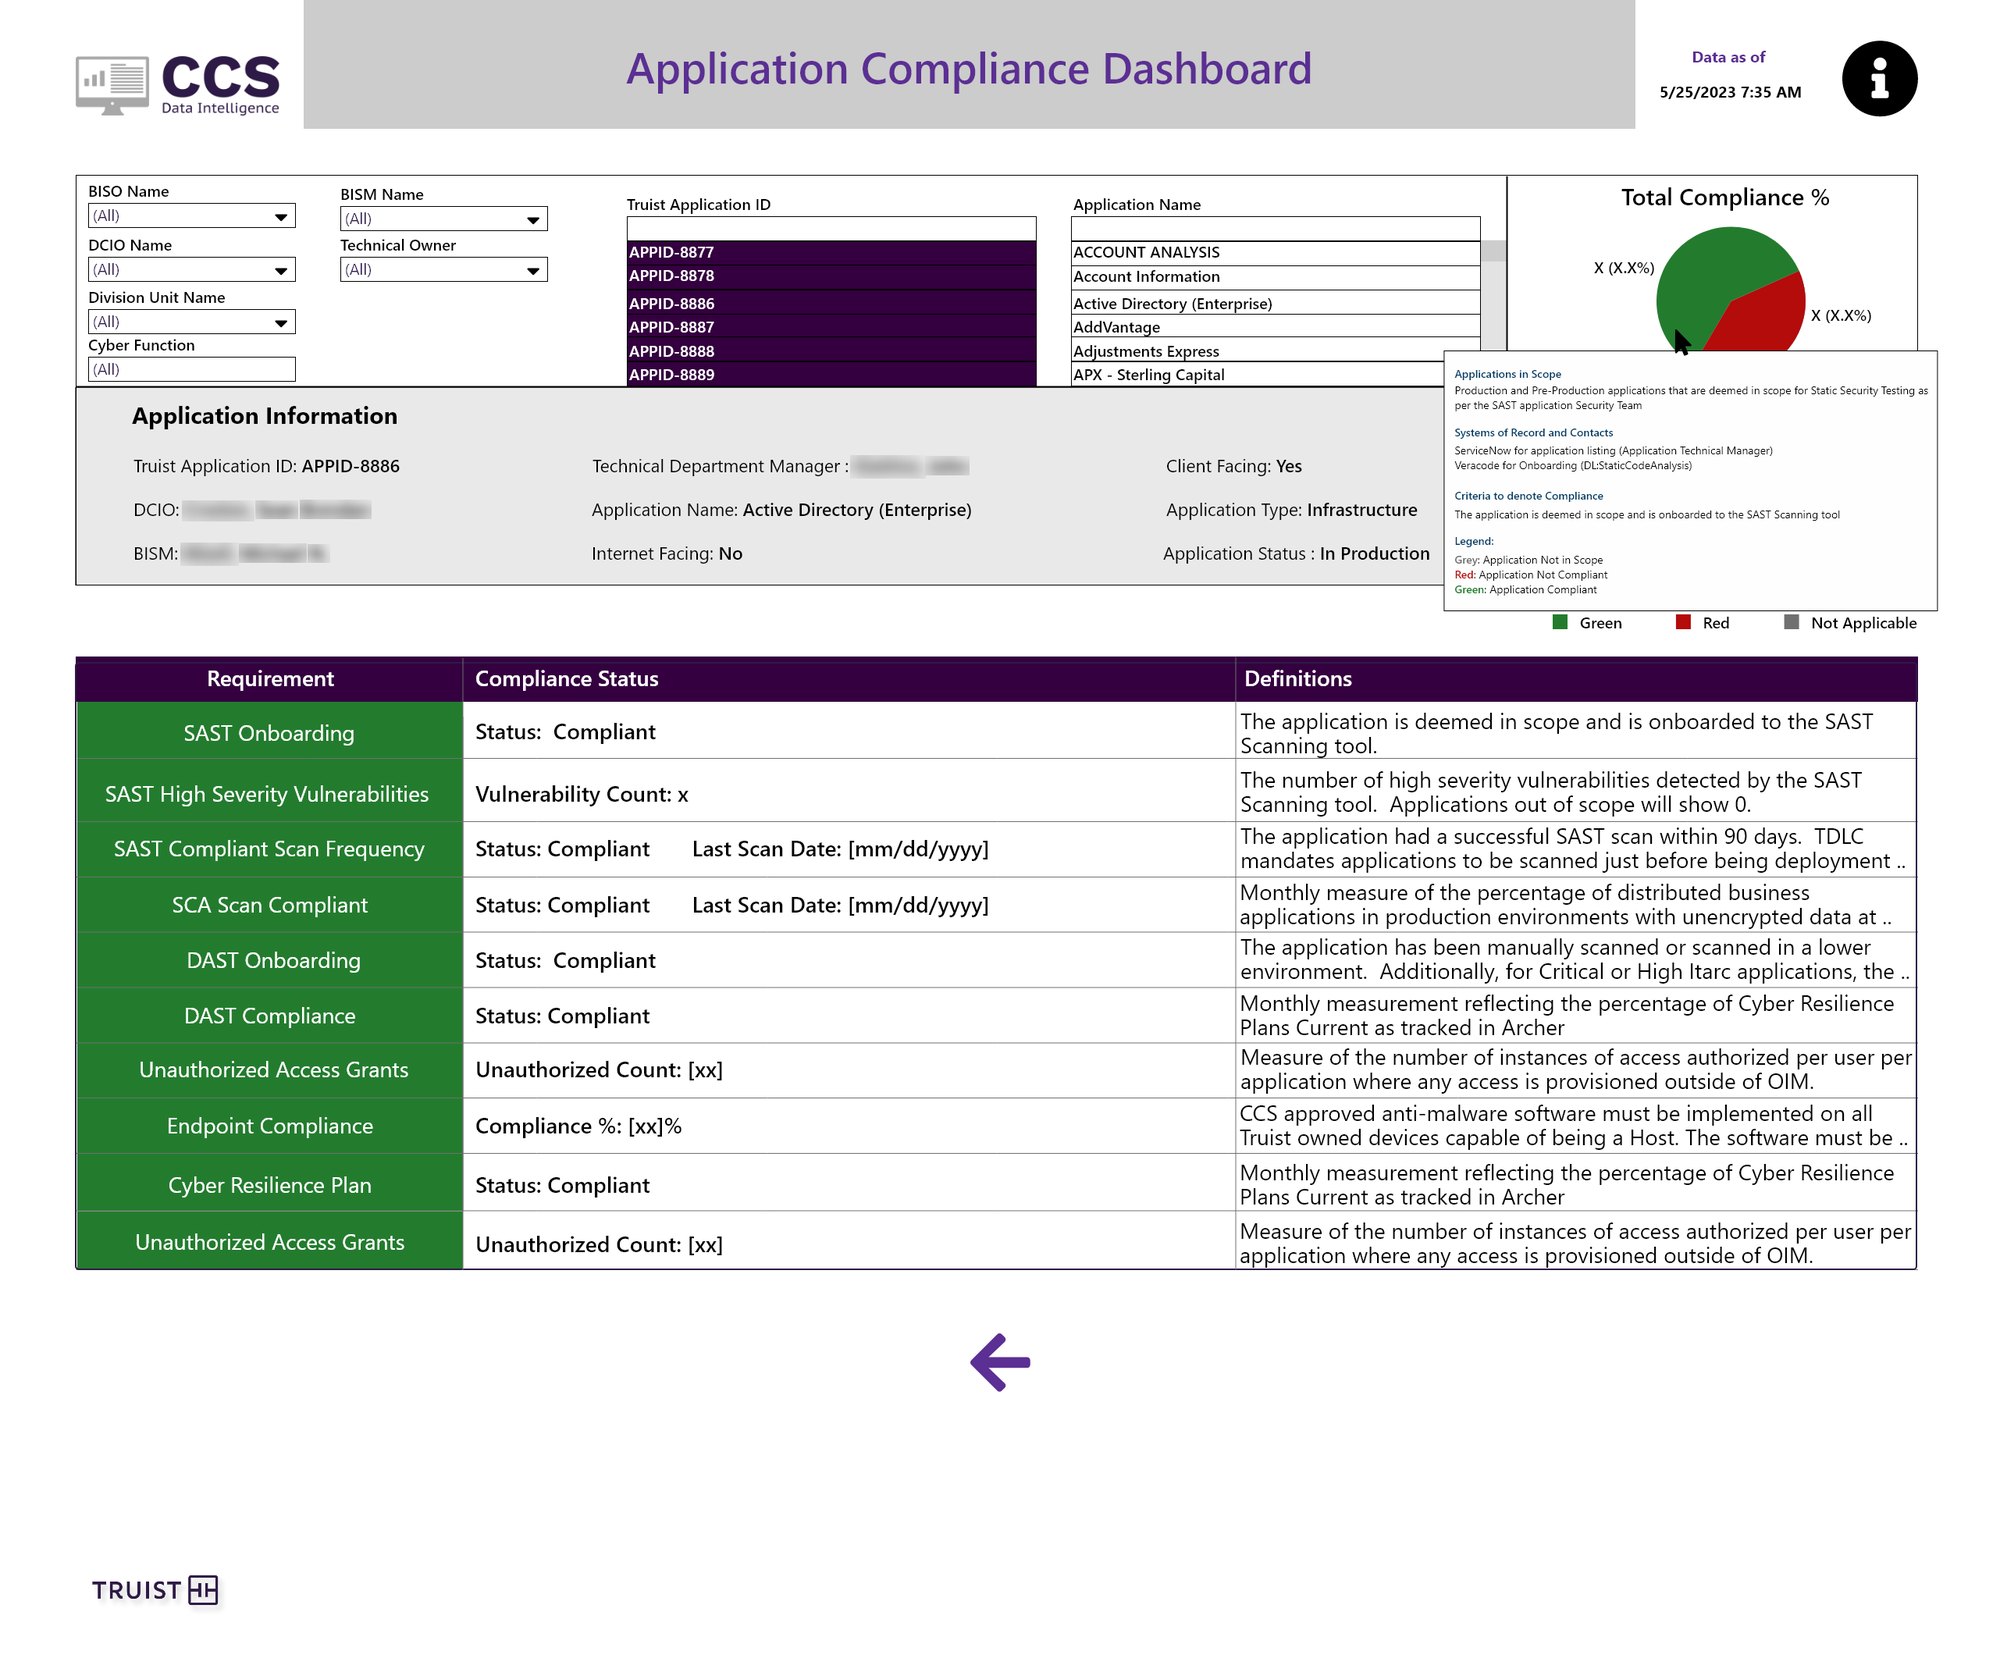
tableau · Application Compliance

Info tooltips explain scope, source systems and the exact criteria for compliance.

Definitions in context

Every requirement explains itself right on the row, so nobody has to look up a policy doc.

One app, one page

Owners, platform, risk rating and hosting are pinned above the scorecard.

Tool by tool

Coverage per tool shows exactly which agent is missing, not just that something is.

04.4 — Risk & controls

Follow a risk all the way to its fix.

The Process, Risks & Controls dashboard connects the full governance chain: business processes, risks, controls, findings, remediation items, metrics and policies. A home view summarizes by InfoSec tower, and each count opens a detail view with a second level for the deeper fields.
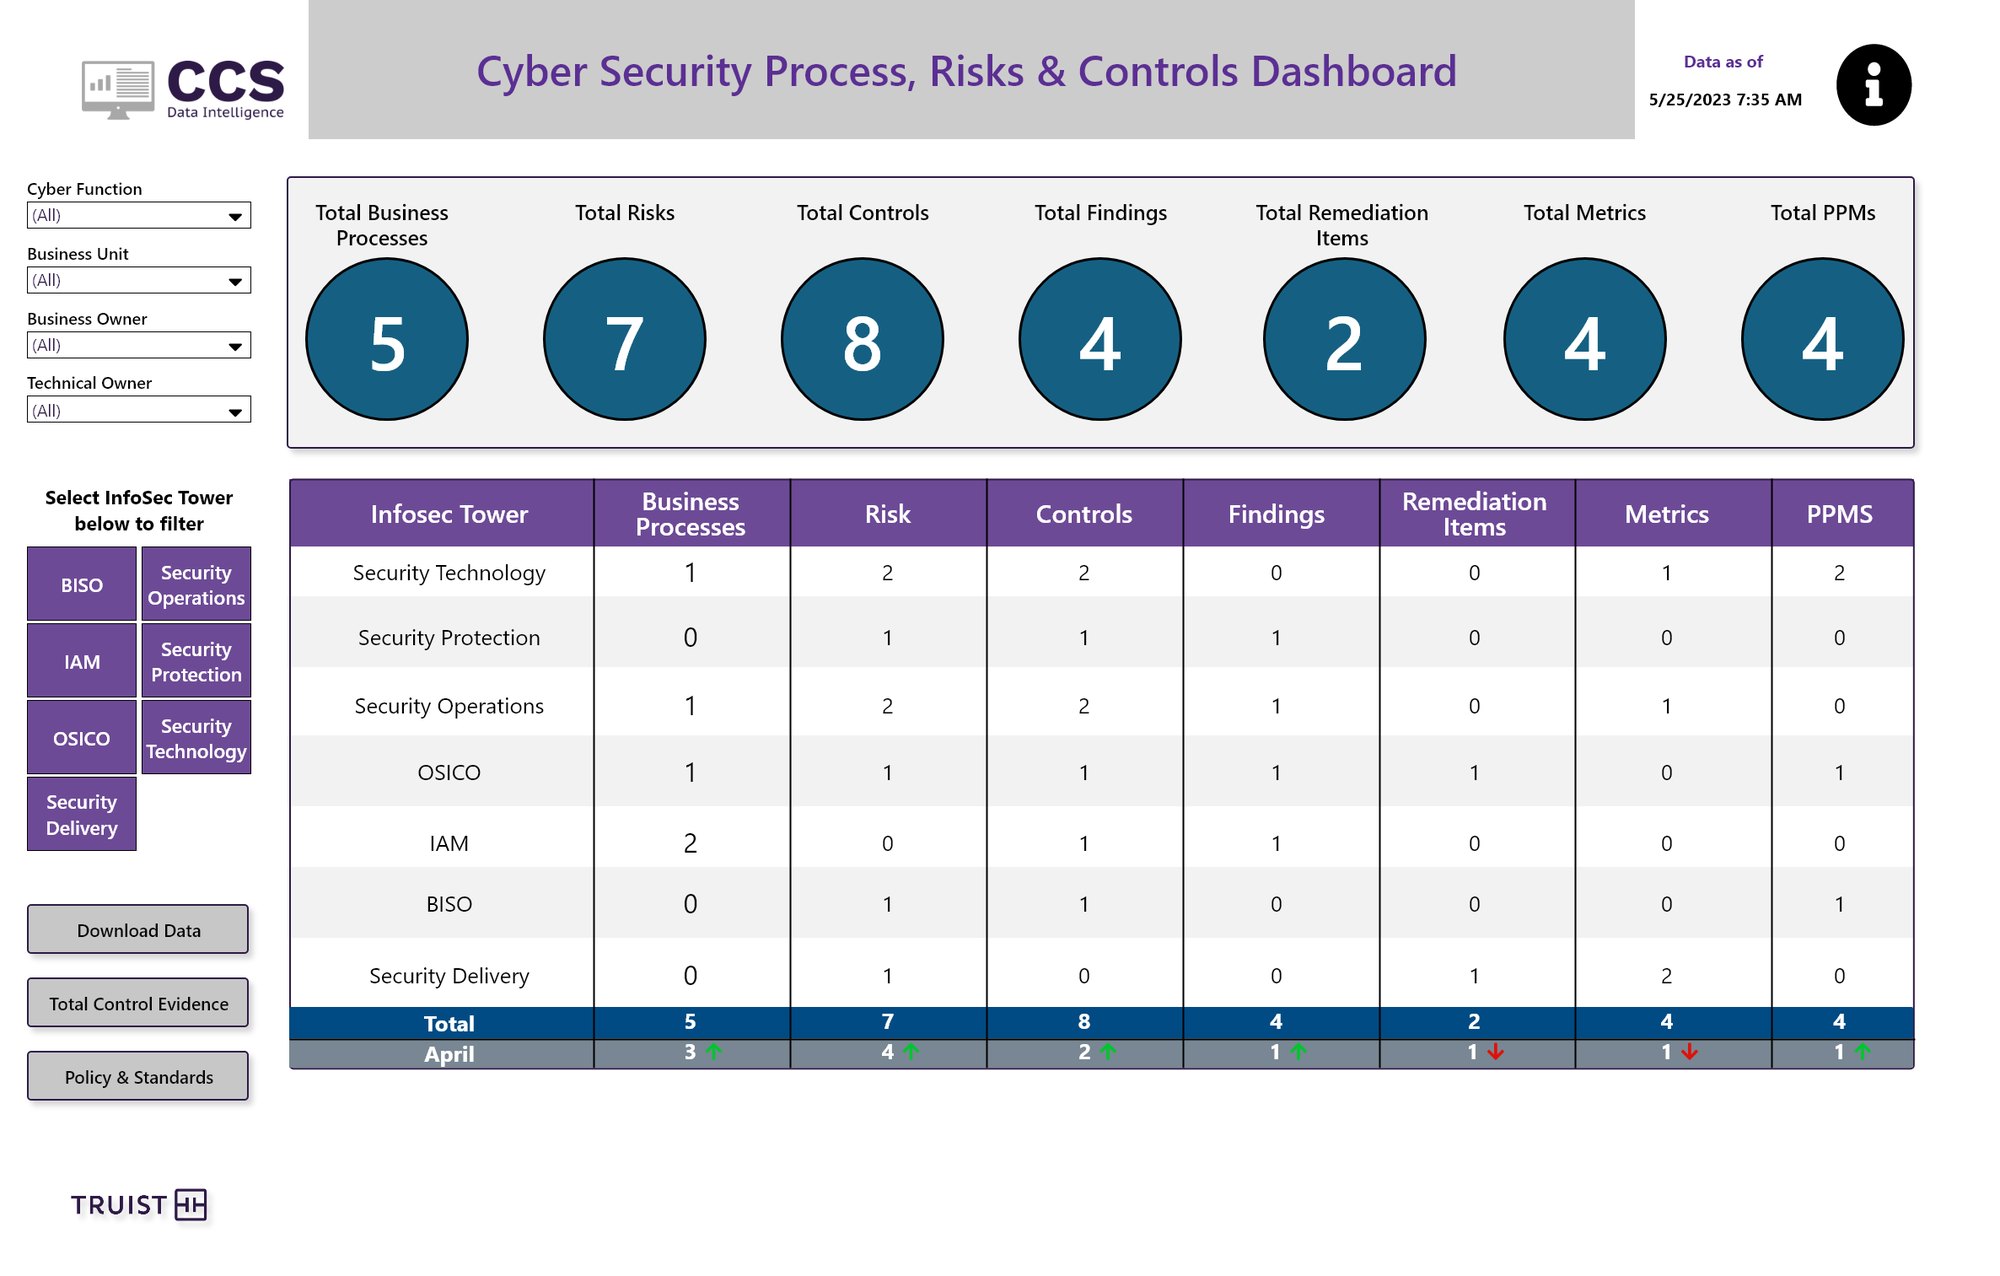
tableau · Cyber Security Process, Risks & Controls

Seven totals across the top, then a tower-by-tower breakdown with month-over-month change.
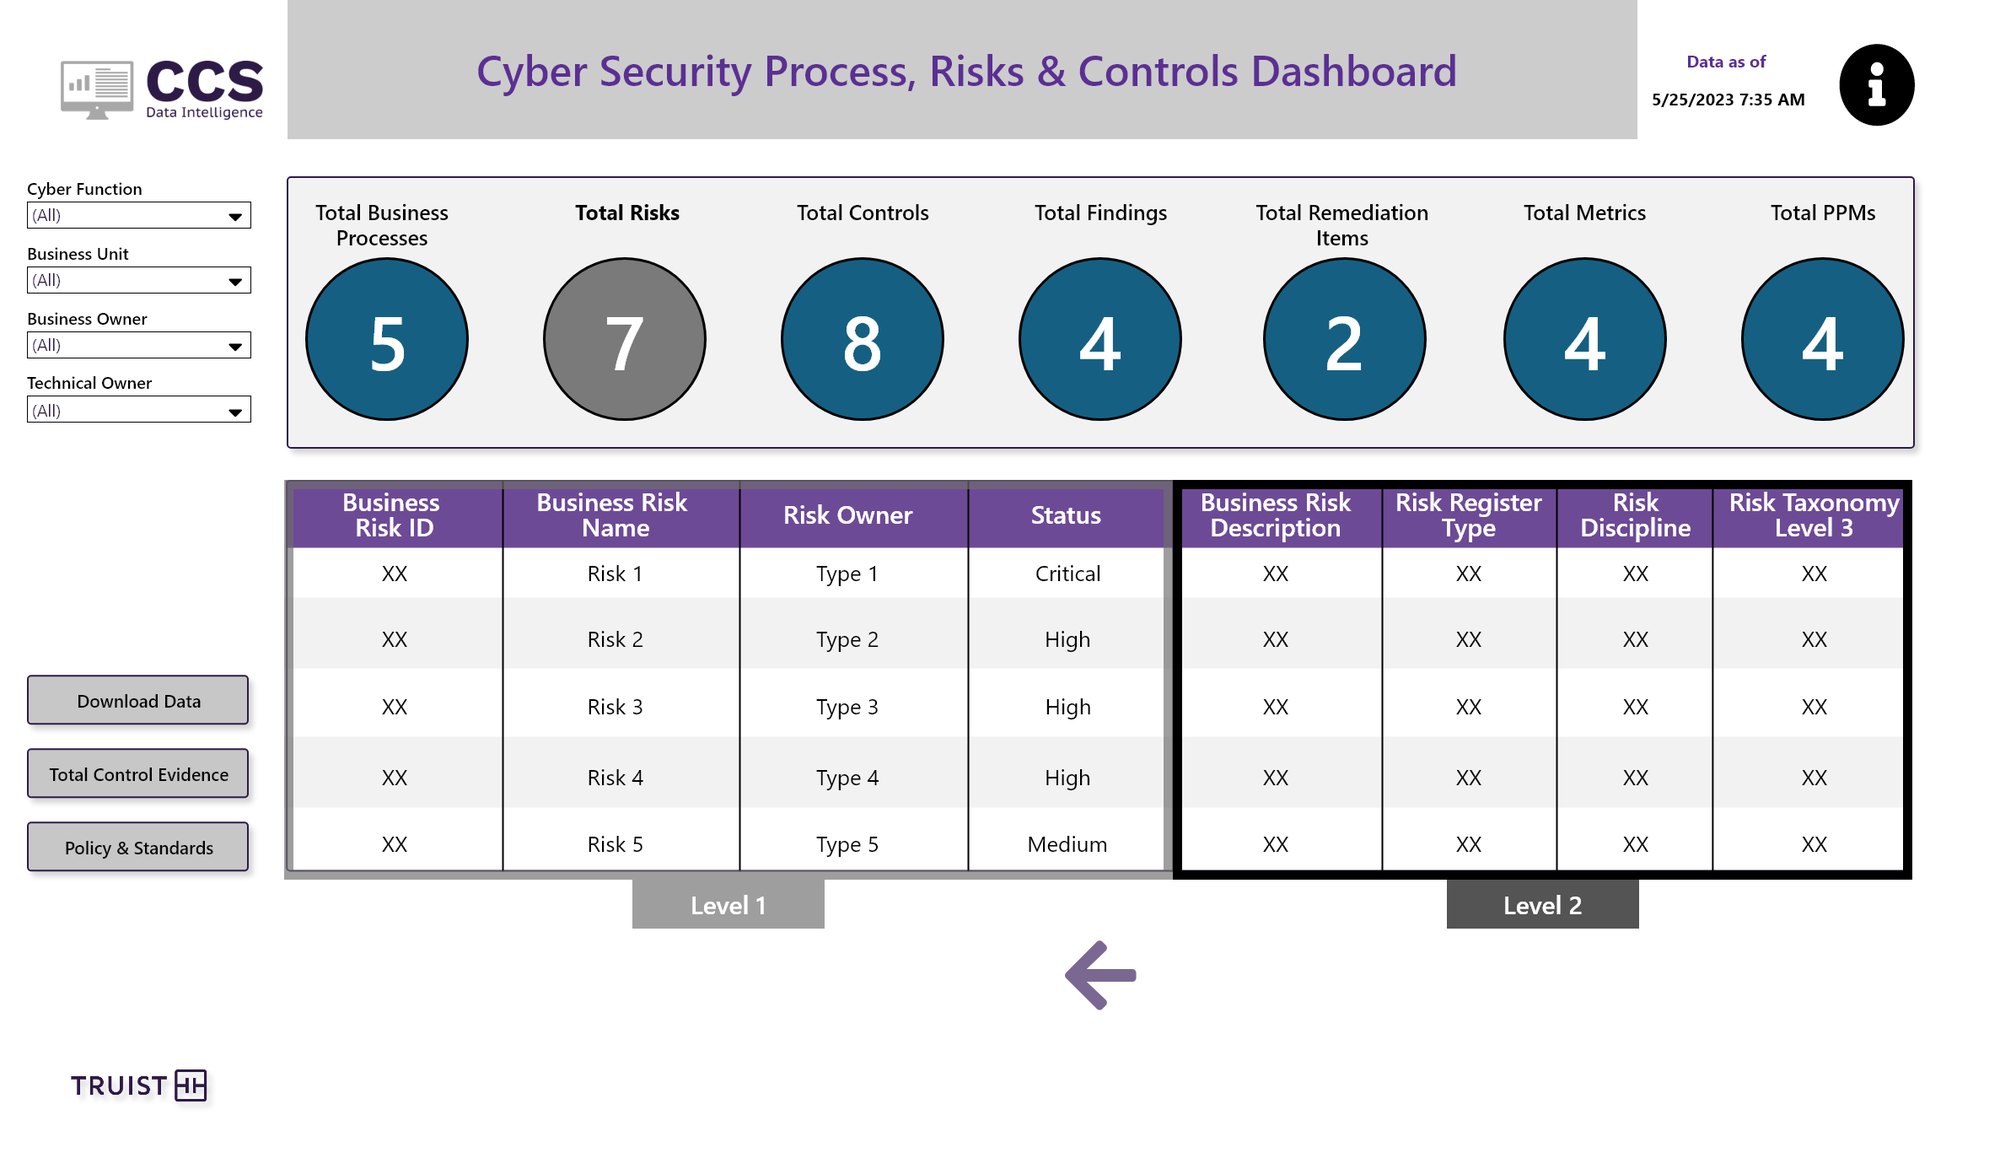
tableau · PRC / Risk view

Level 1 shows the essentials. Level 2 adds description, register type, discipline and taxonomy.
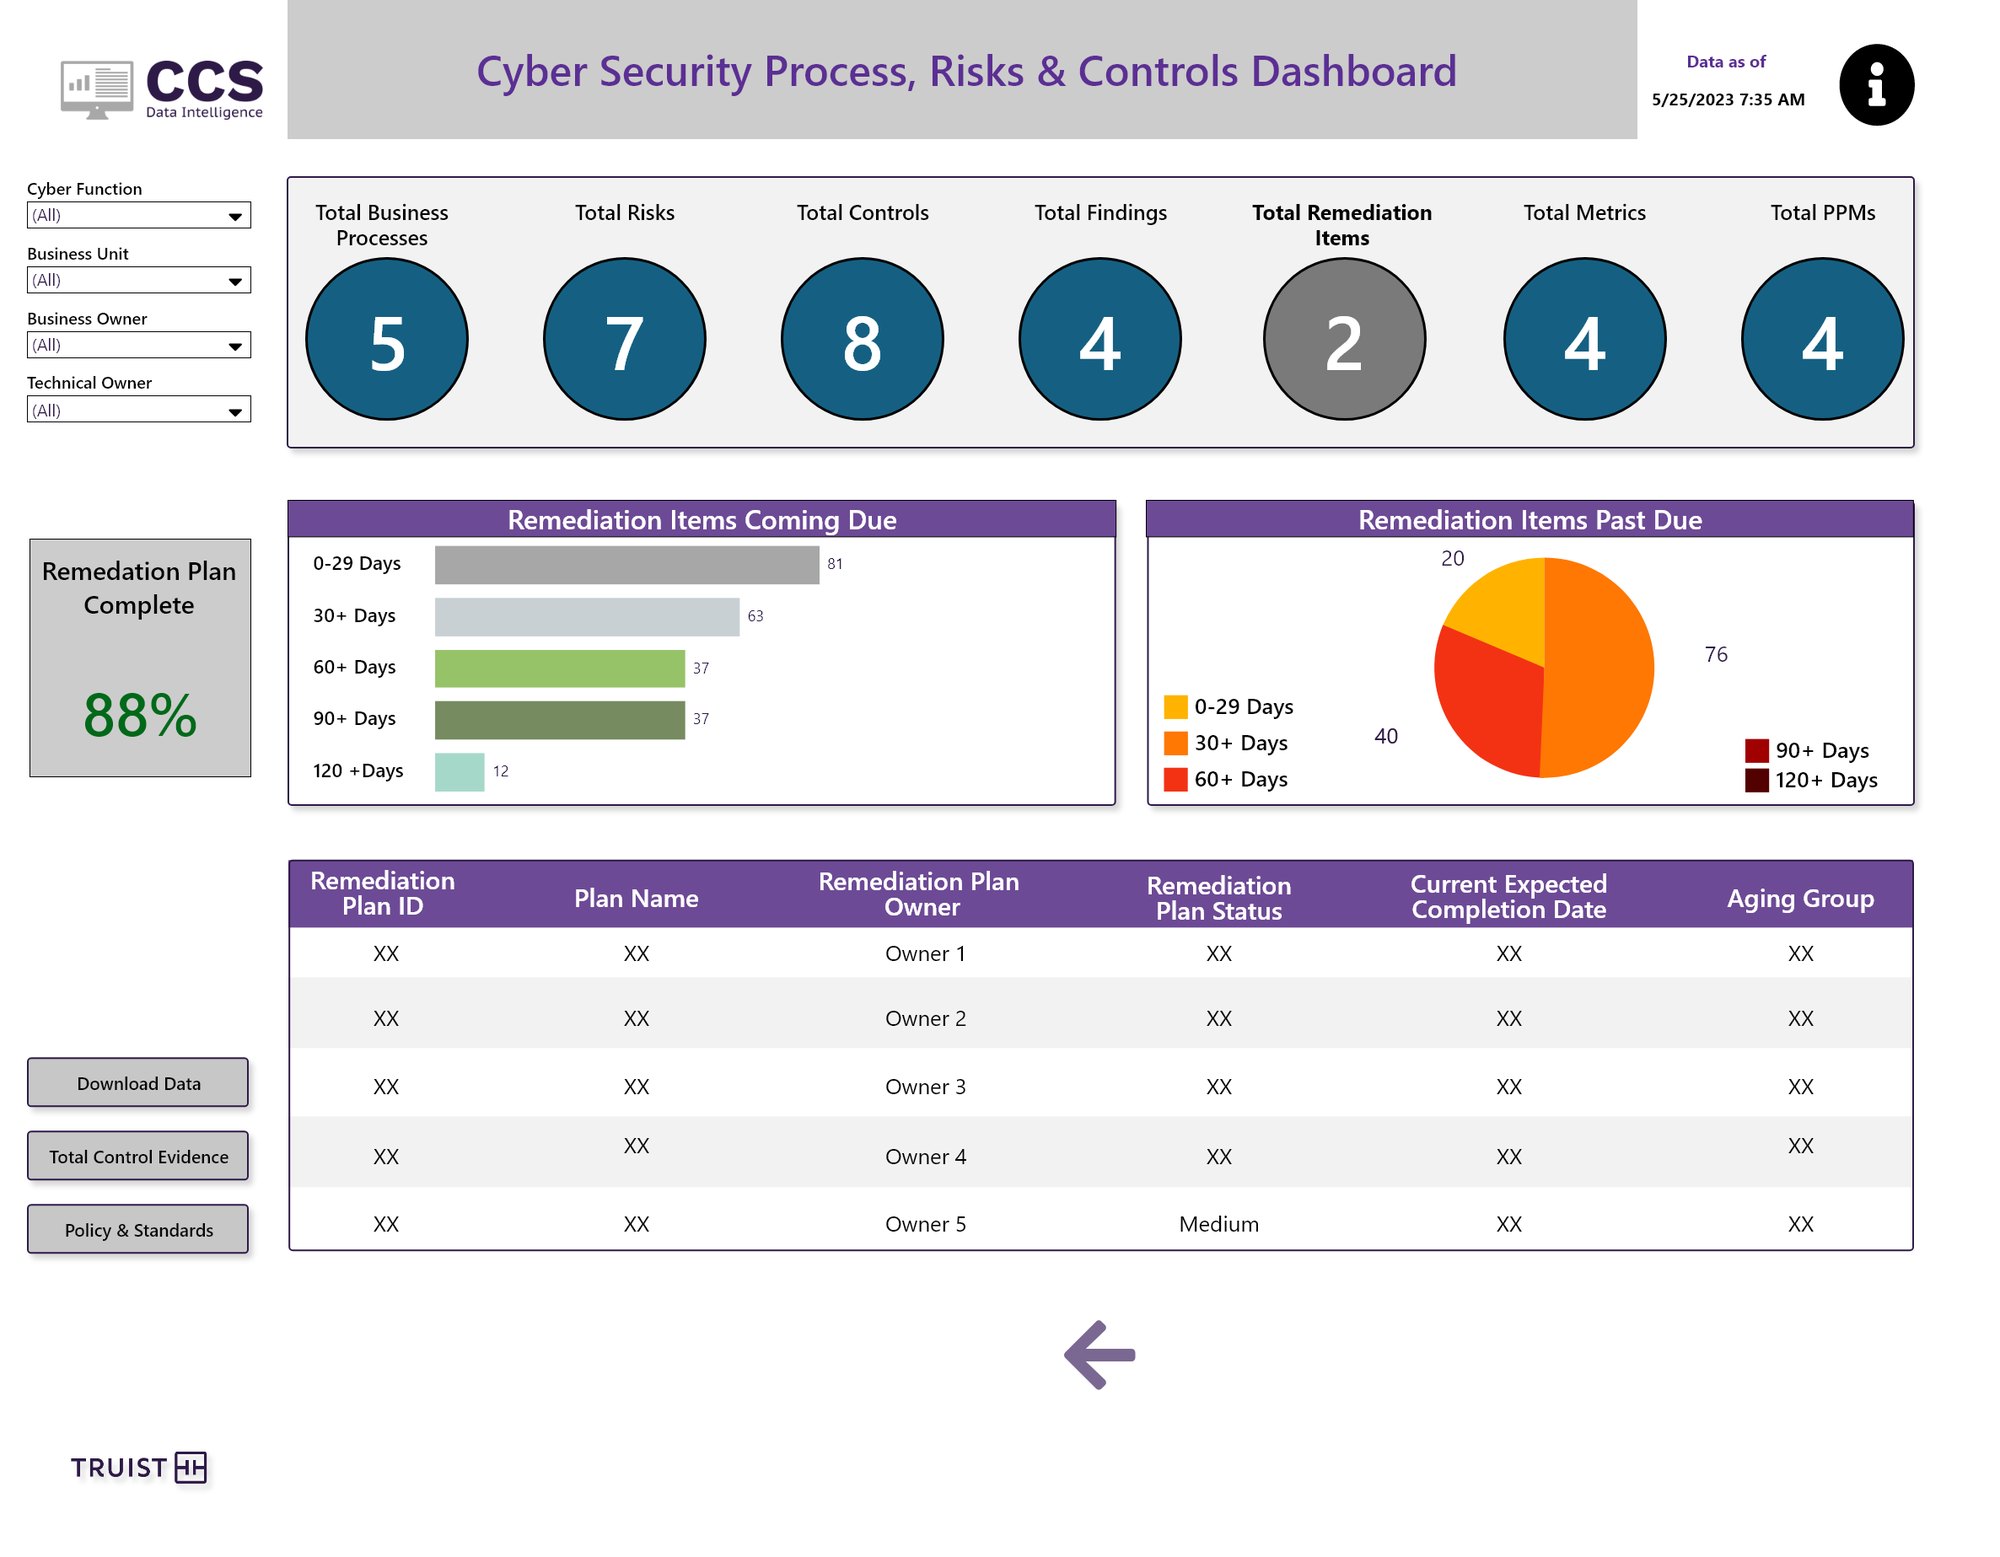
tableau · PRC / Remediation

Items coming due and past due by age, plus overall plan completion.
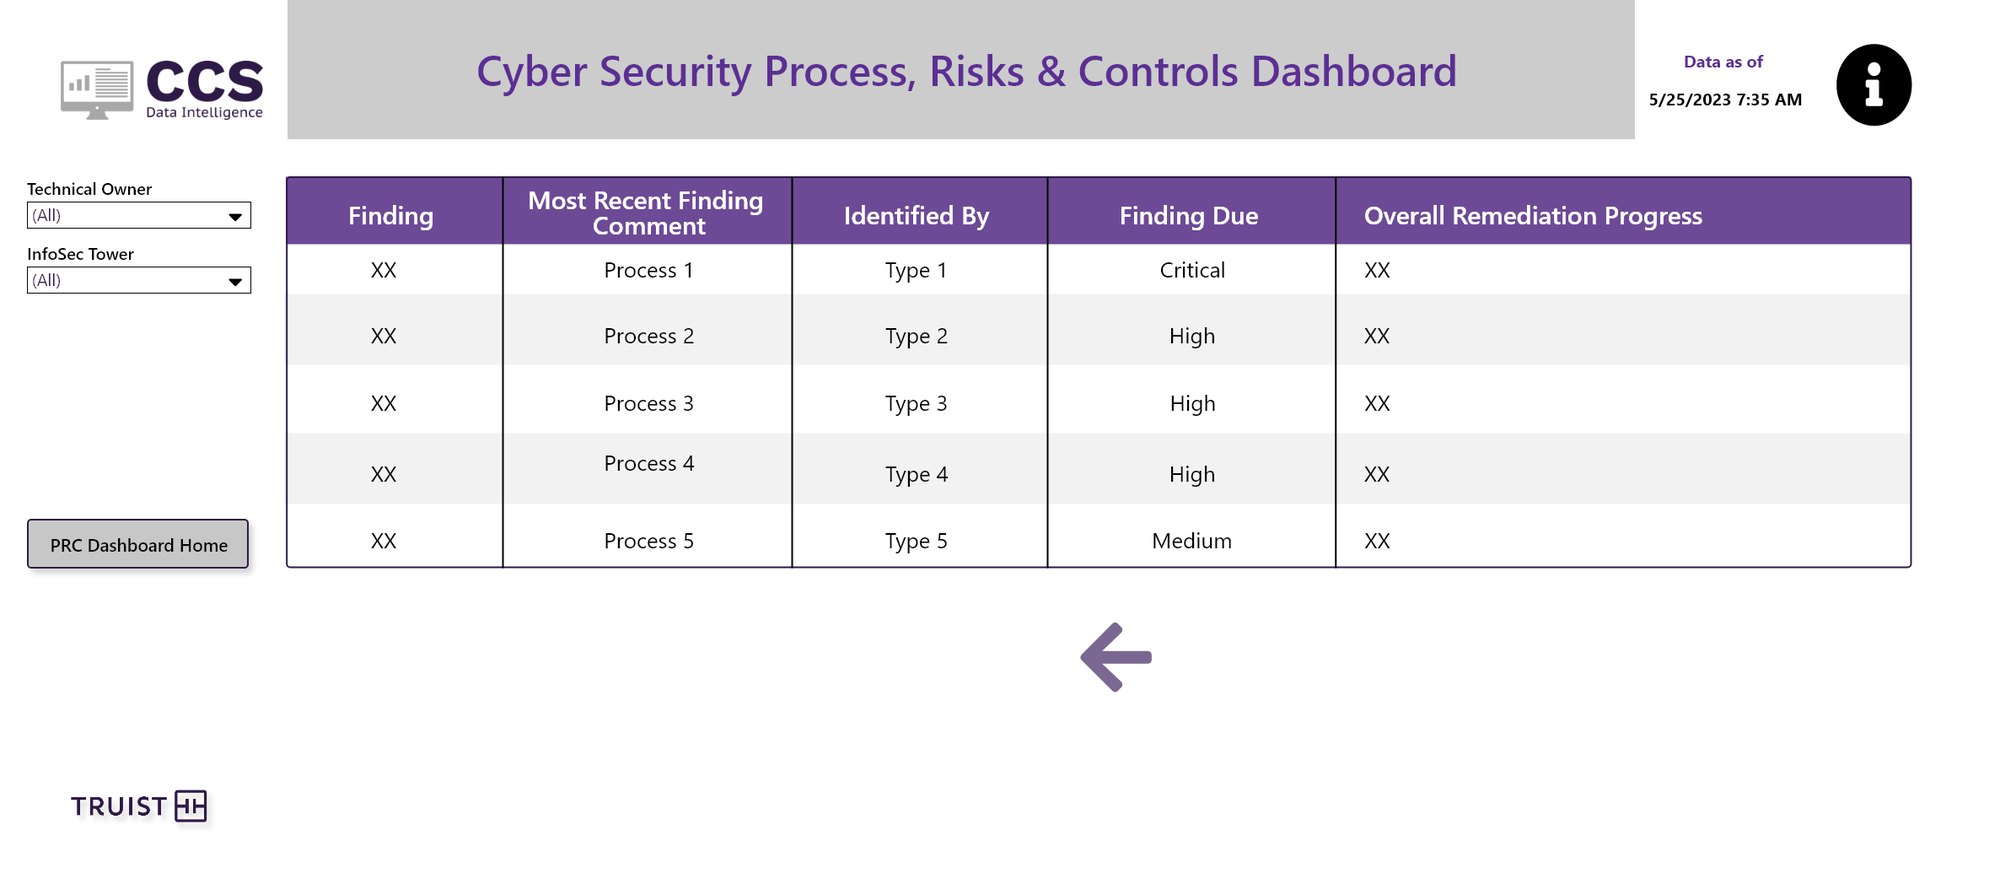
tableau · PRC / Findings, Level 2

Detail views keep a clear path back to the PRC home.

The counts are the navigation

Clicking a total opens that view, and the active total turns grey so you always know where you are.

Two levels of detail

Level 1 for scanning, Level 2 for audit-grade detail, without crowding one table.

Aging up front

Remediation is grouped by days past due, which is what drives escalations.

04.5 — Accounts & governance

From the whole portfolio to one login.

Shared User & Service Account Compliance starts with total compliance and owners, then drills into one application down to each account's vaulting, verification and password rotation. Wire System Security Governance tracks adherence across the bank's wire applications.
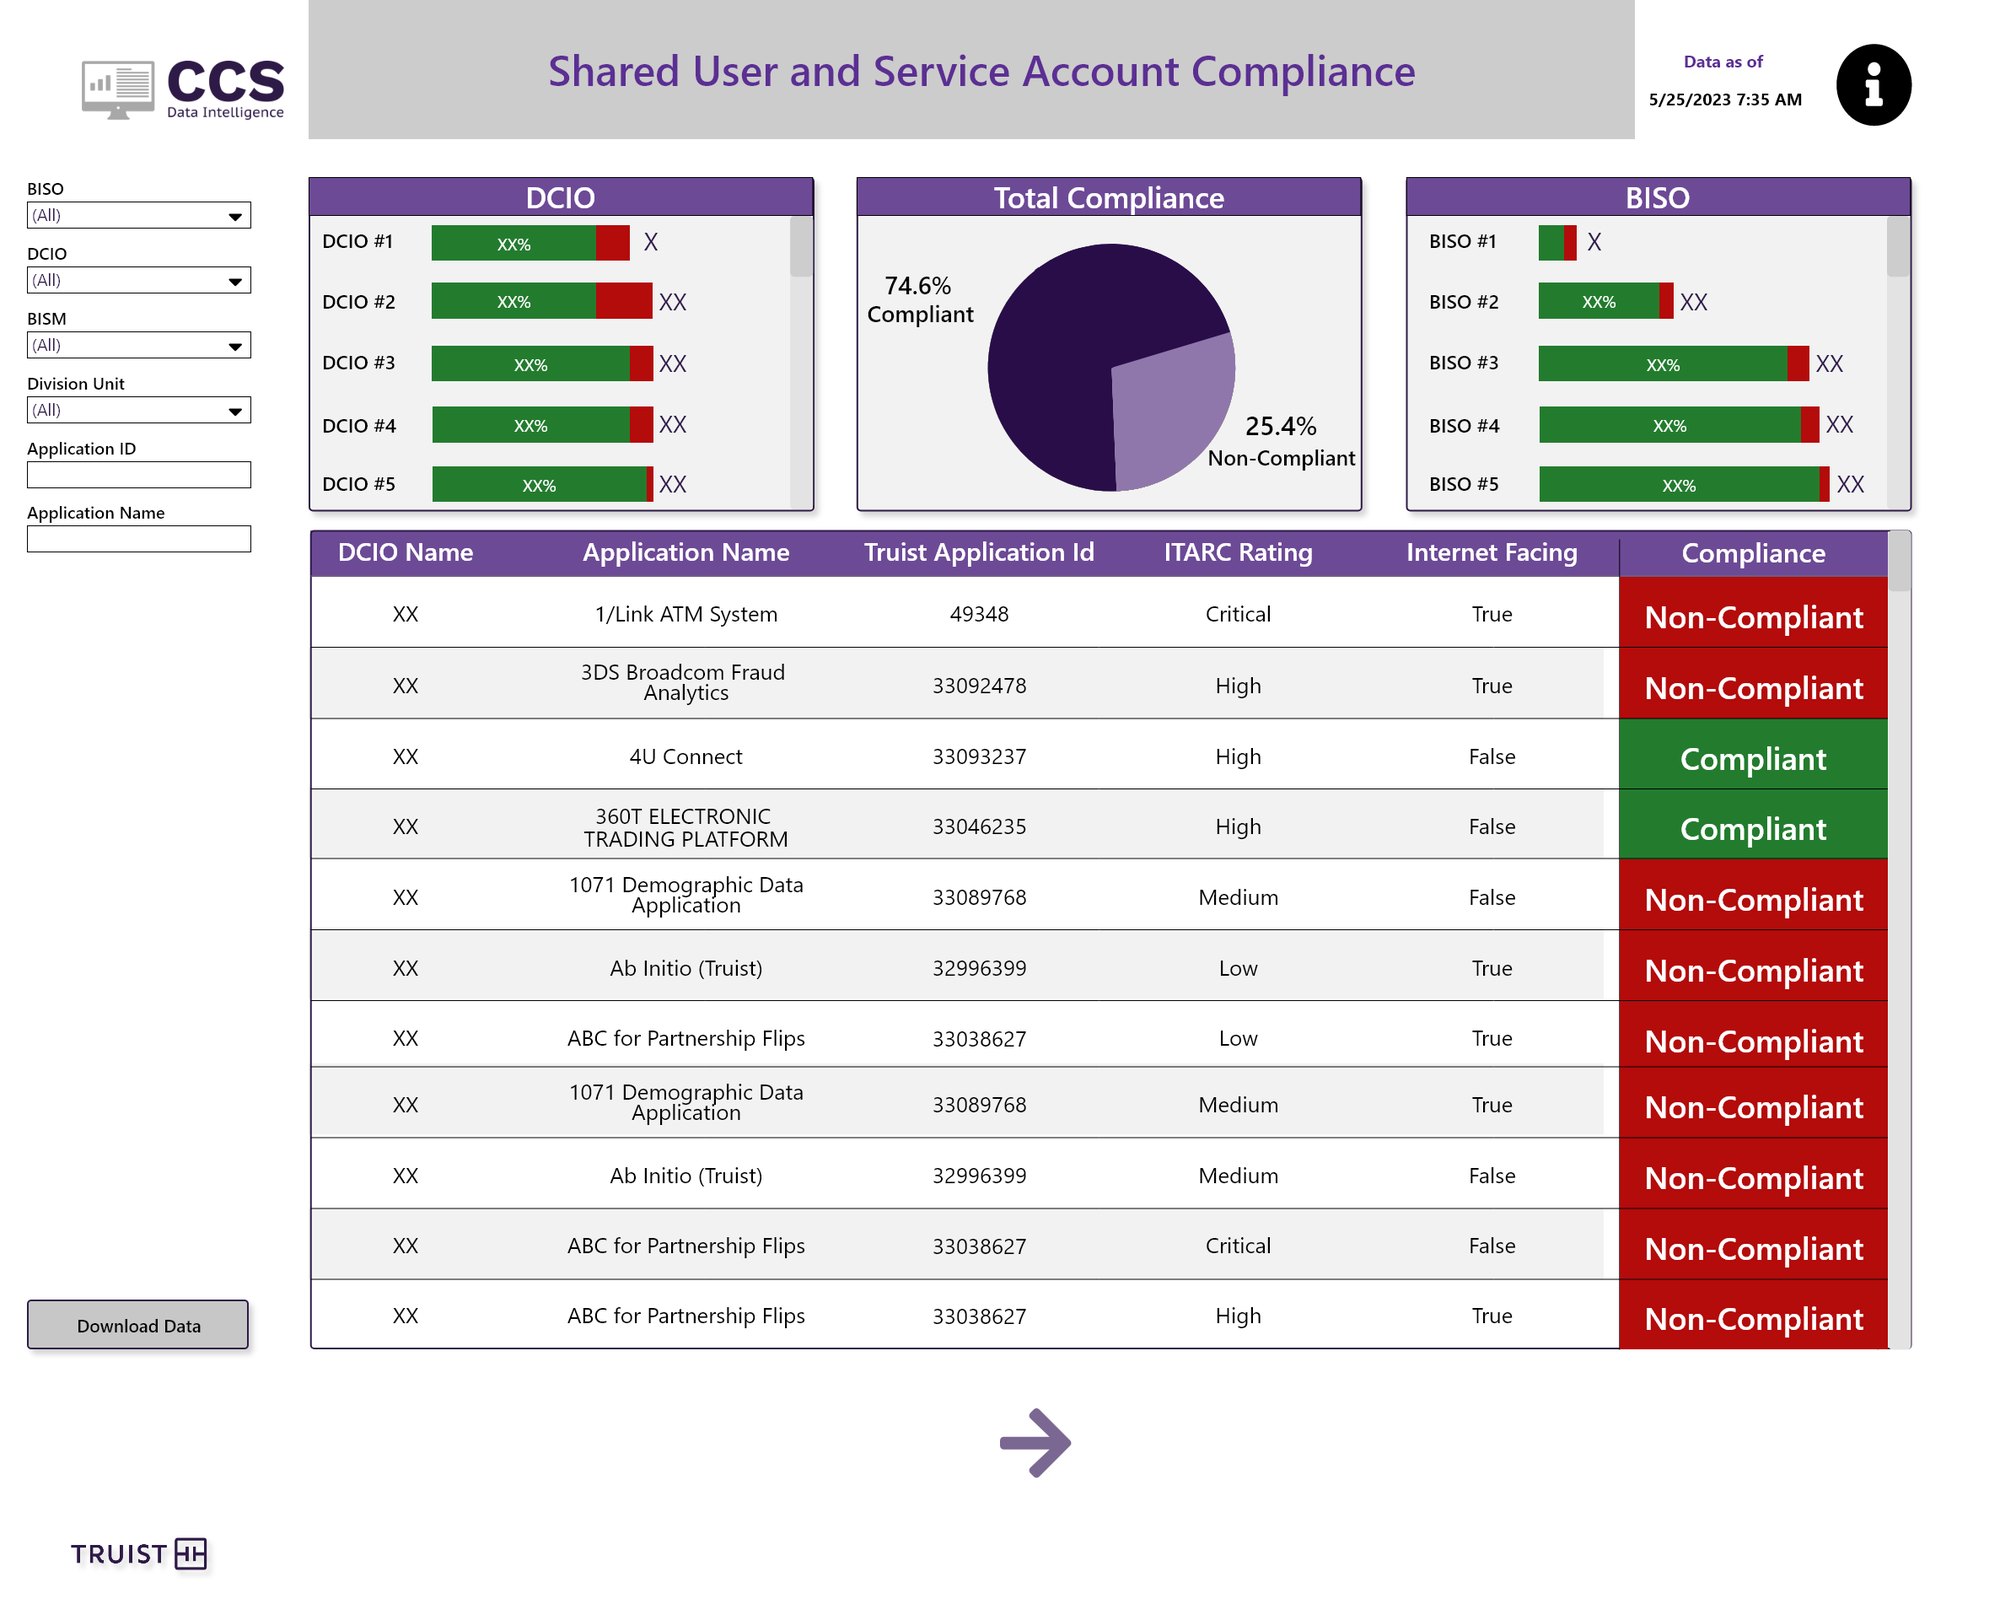
tableau · Shared User & Service Account Compliance

Compliance by DCIO and BISO on either side of the overall split, with an app-level table below.
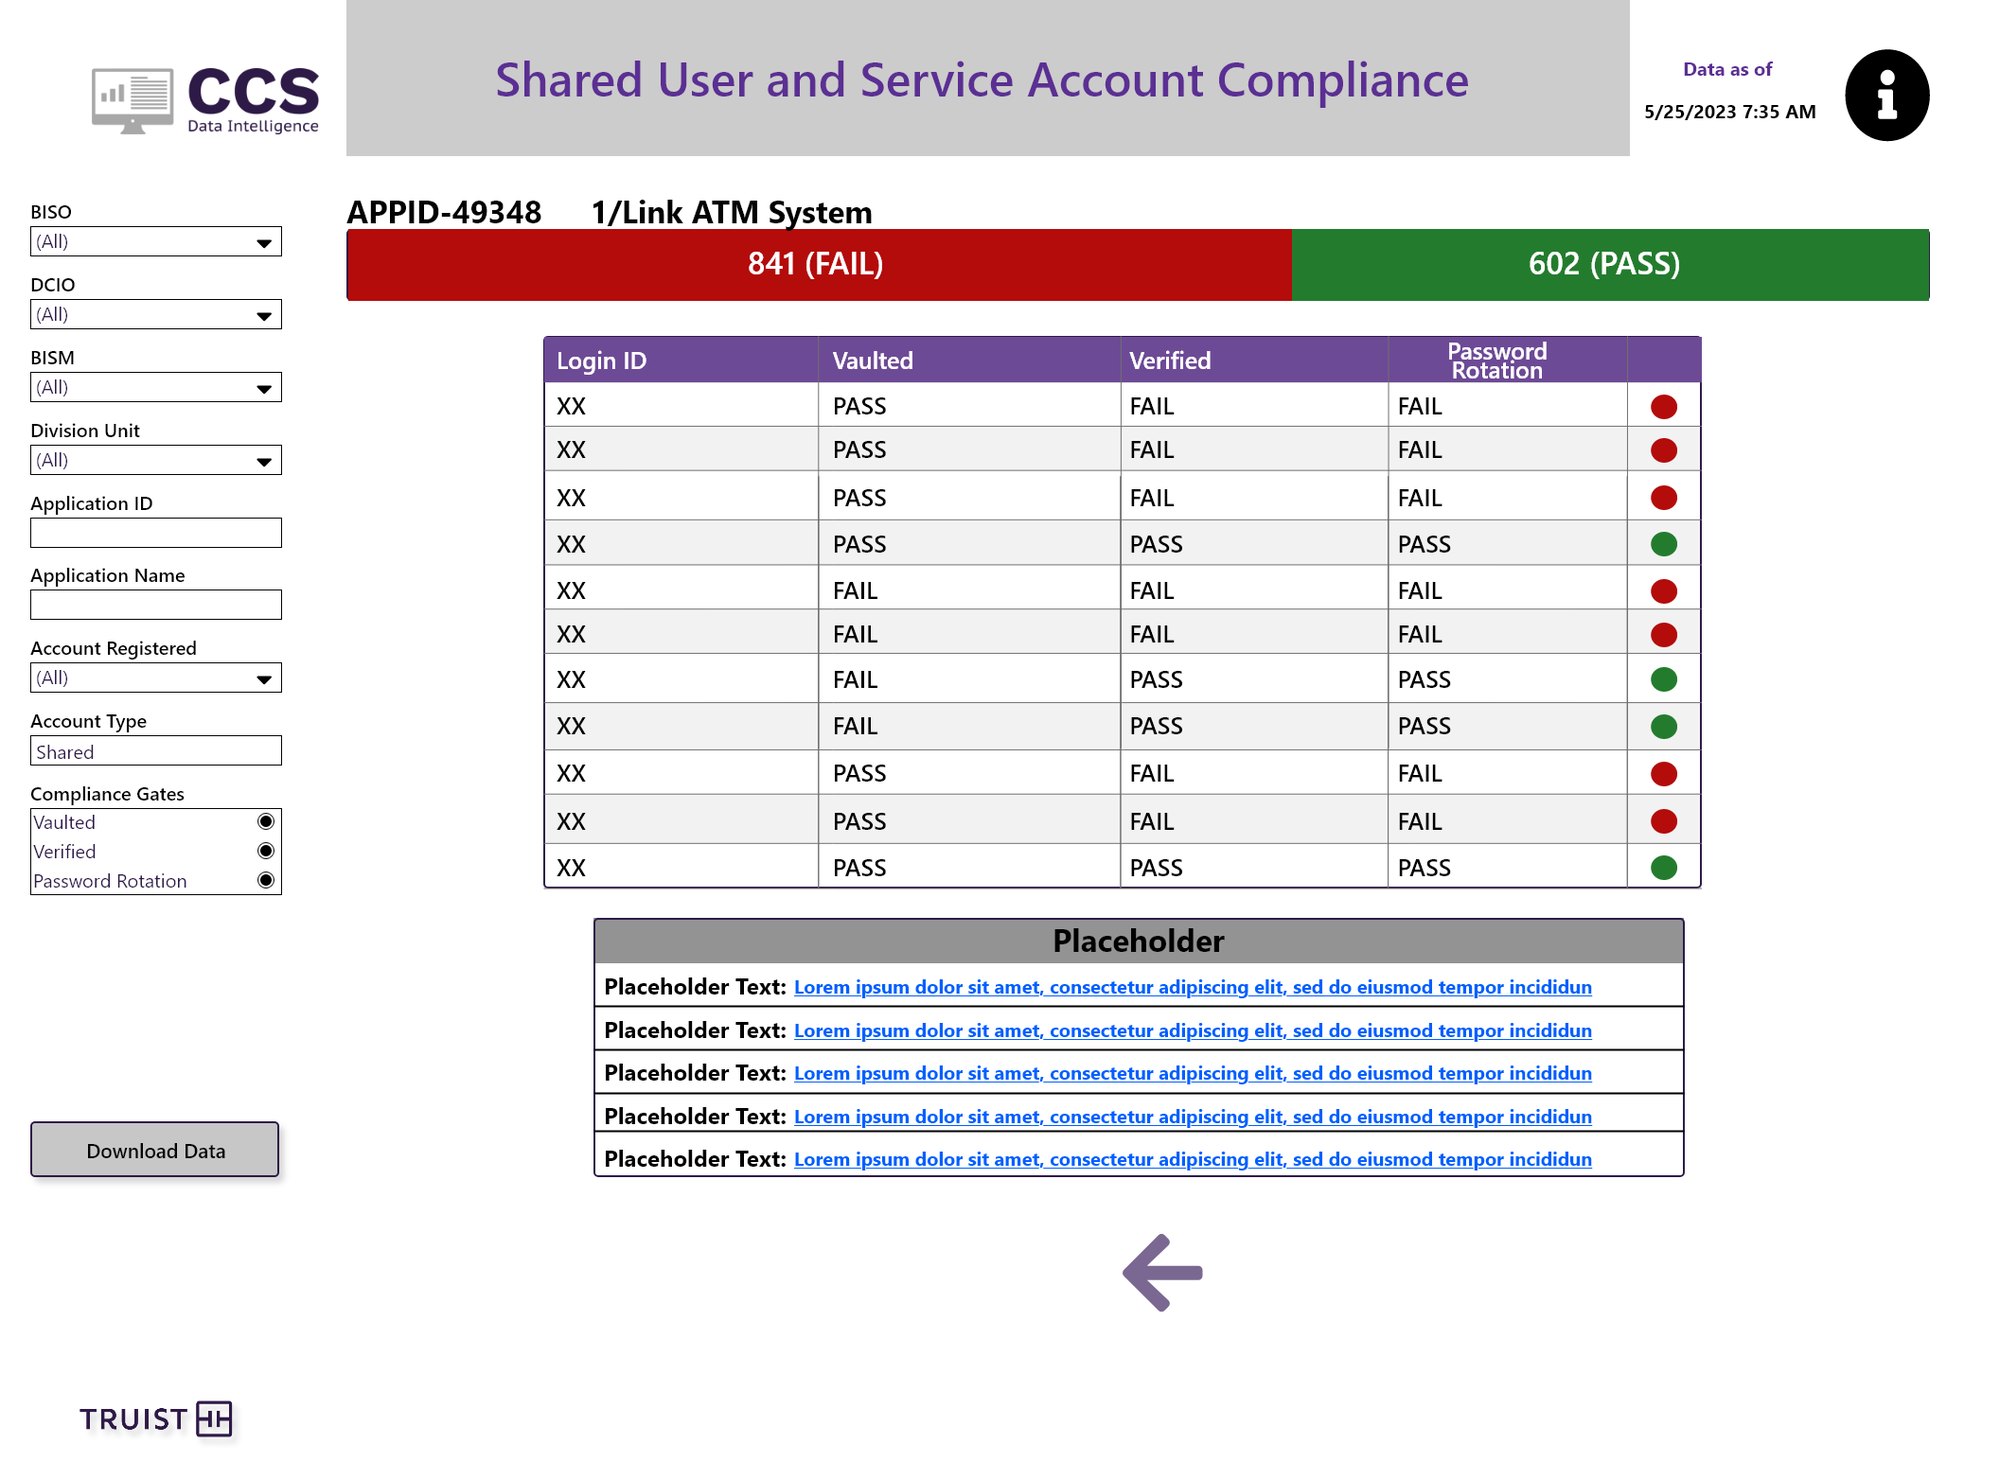
tableau · SUSA / APPID-49348

For one app, each login is checked against three compliance gates.
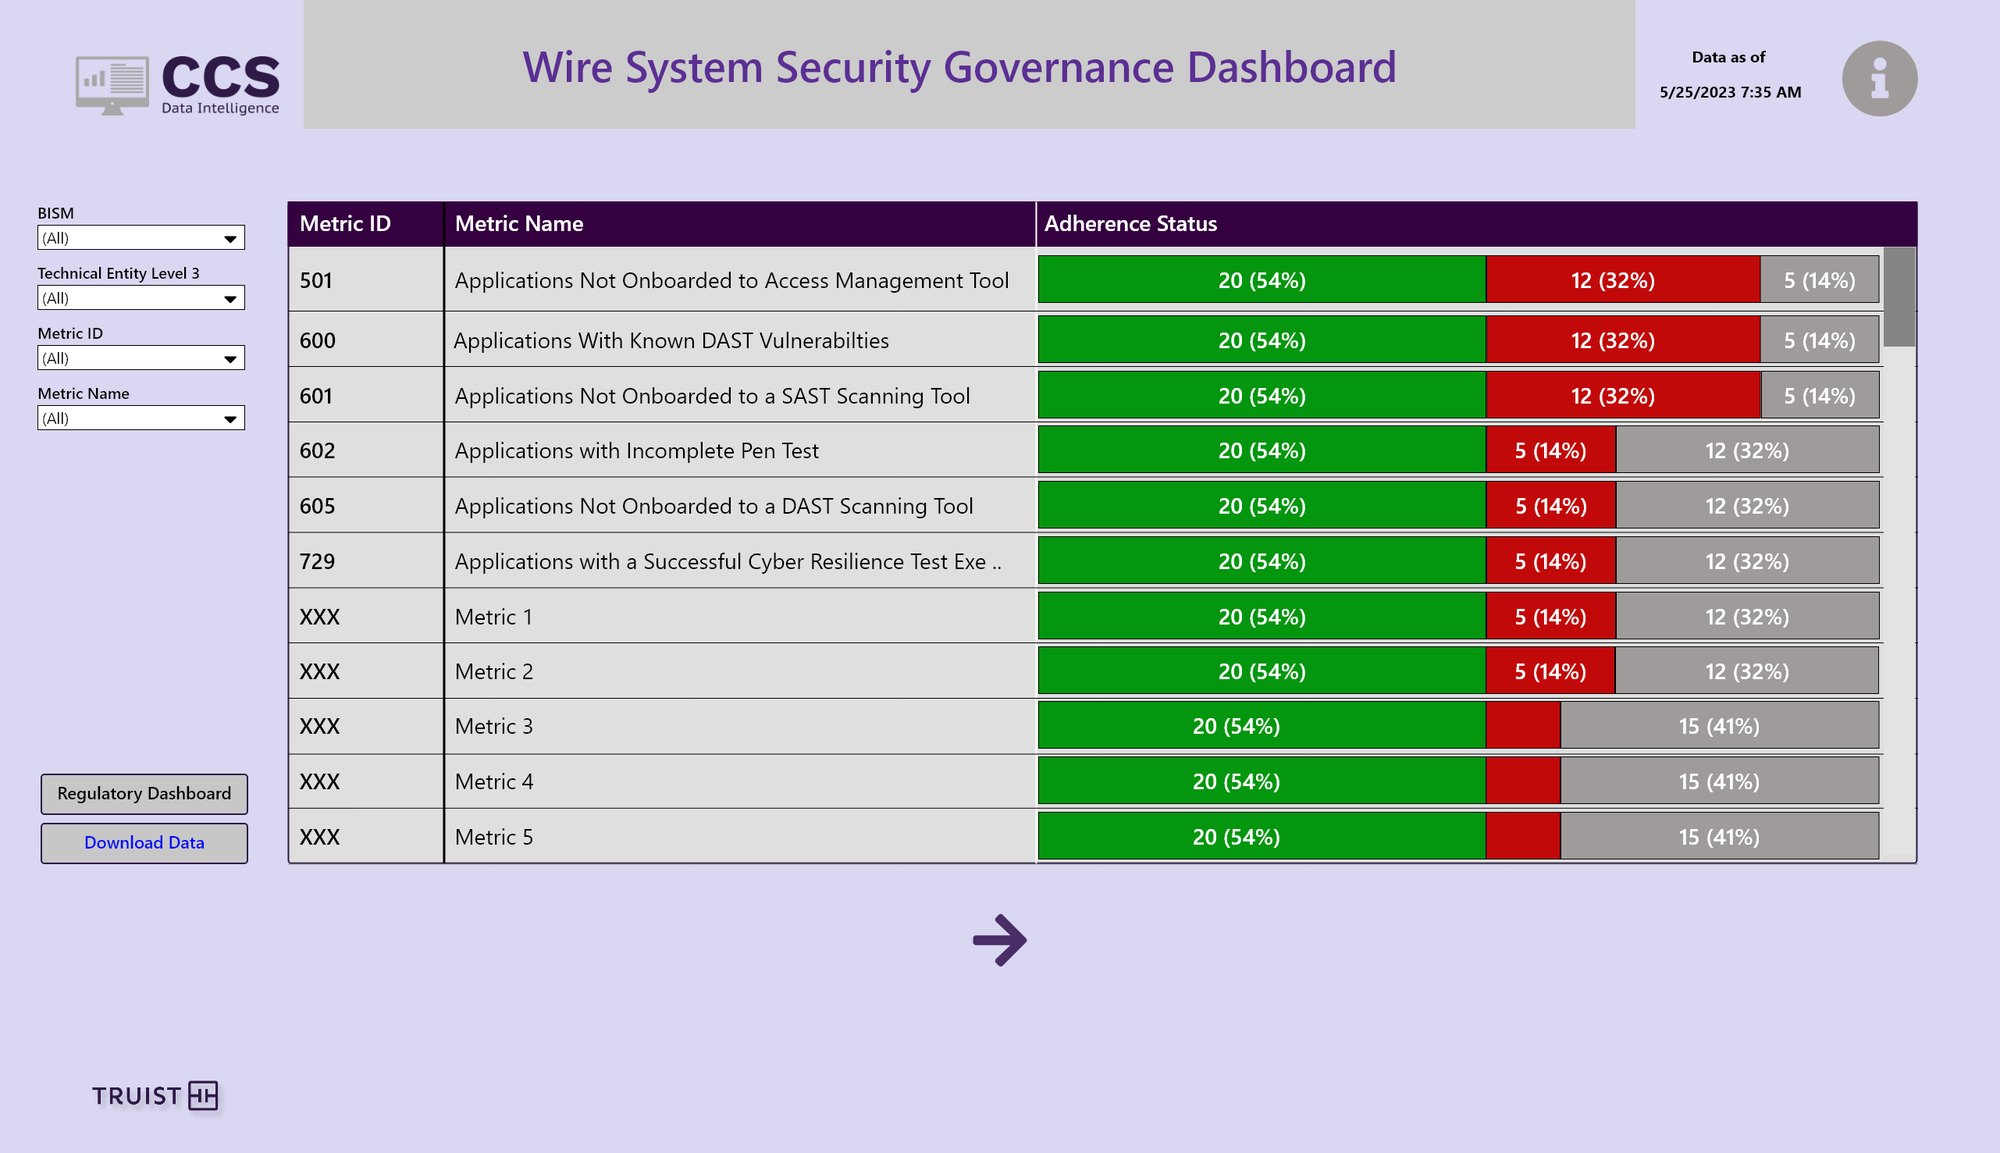
tableau · Wire System Security Governance

Adherence for each metric as a single stacked bar: compliant, non-compliant, not applicable.

Zoom levels

Portfolio, application, account. Each step answers the next obvious question.

Gates, not scores

Pass or fail on each gate makes the fix obvious to an app owner.

One bar per metric

Stacked adherence bars made a long list comparable in one glance.

04.6 — Programs & follow-through

Keep commitments from slipping.

The Cyber Testing & Application Resilience Planning dashboard tracks resilience plans and tests across critical apps, month by month. Cyber Sub-Issues shows what's past due, what's coming due and which drafts are stalled.
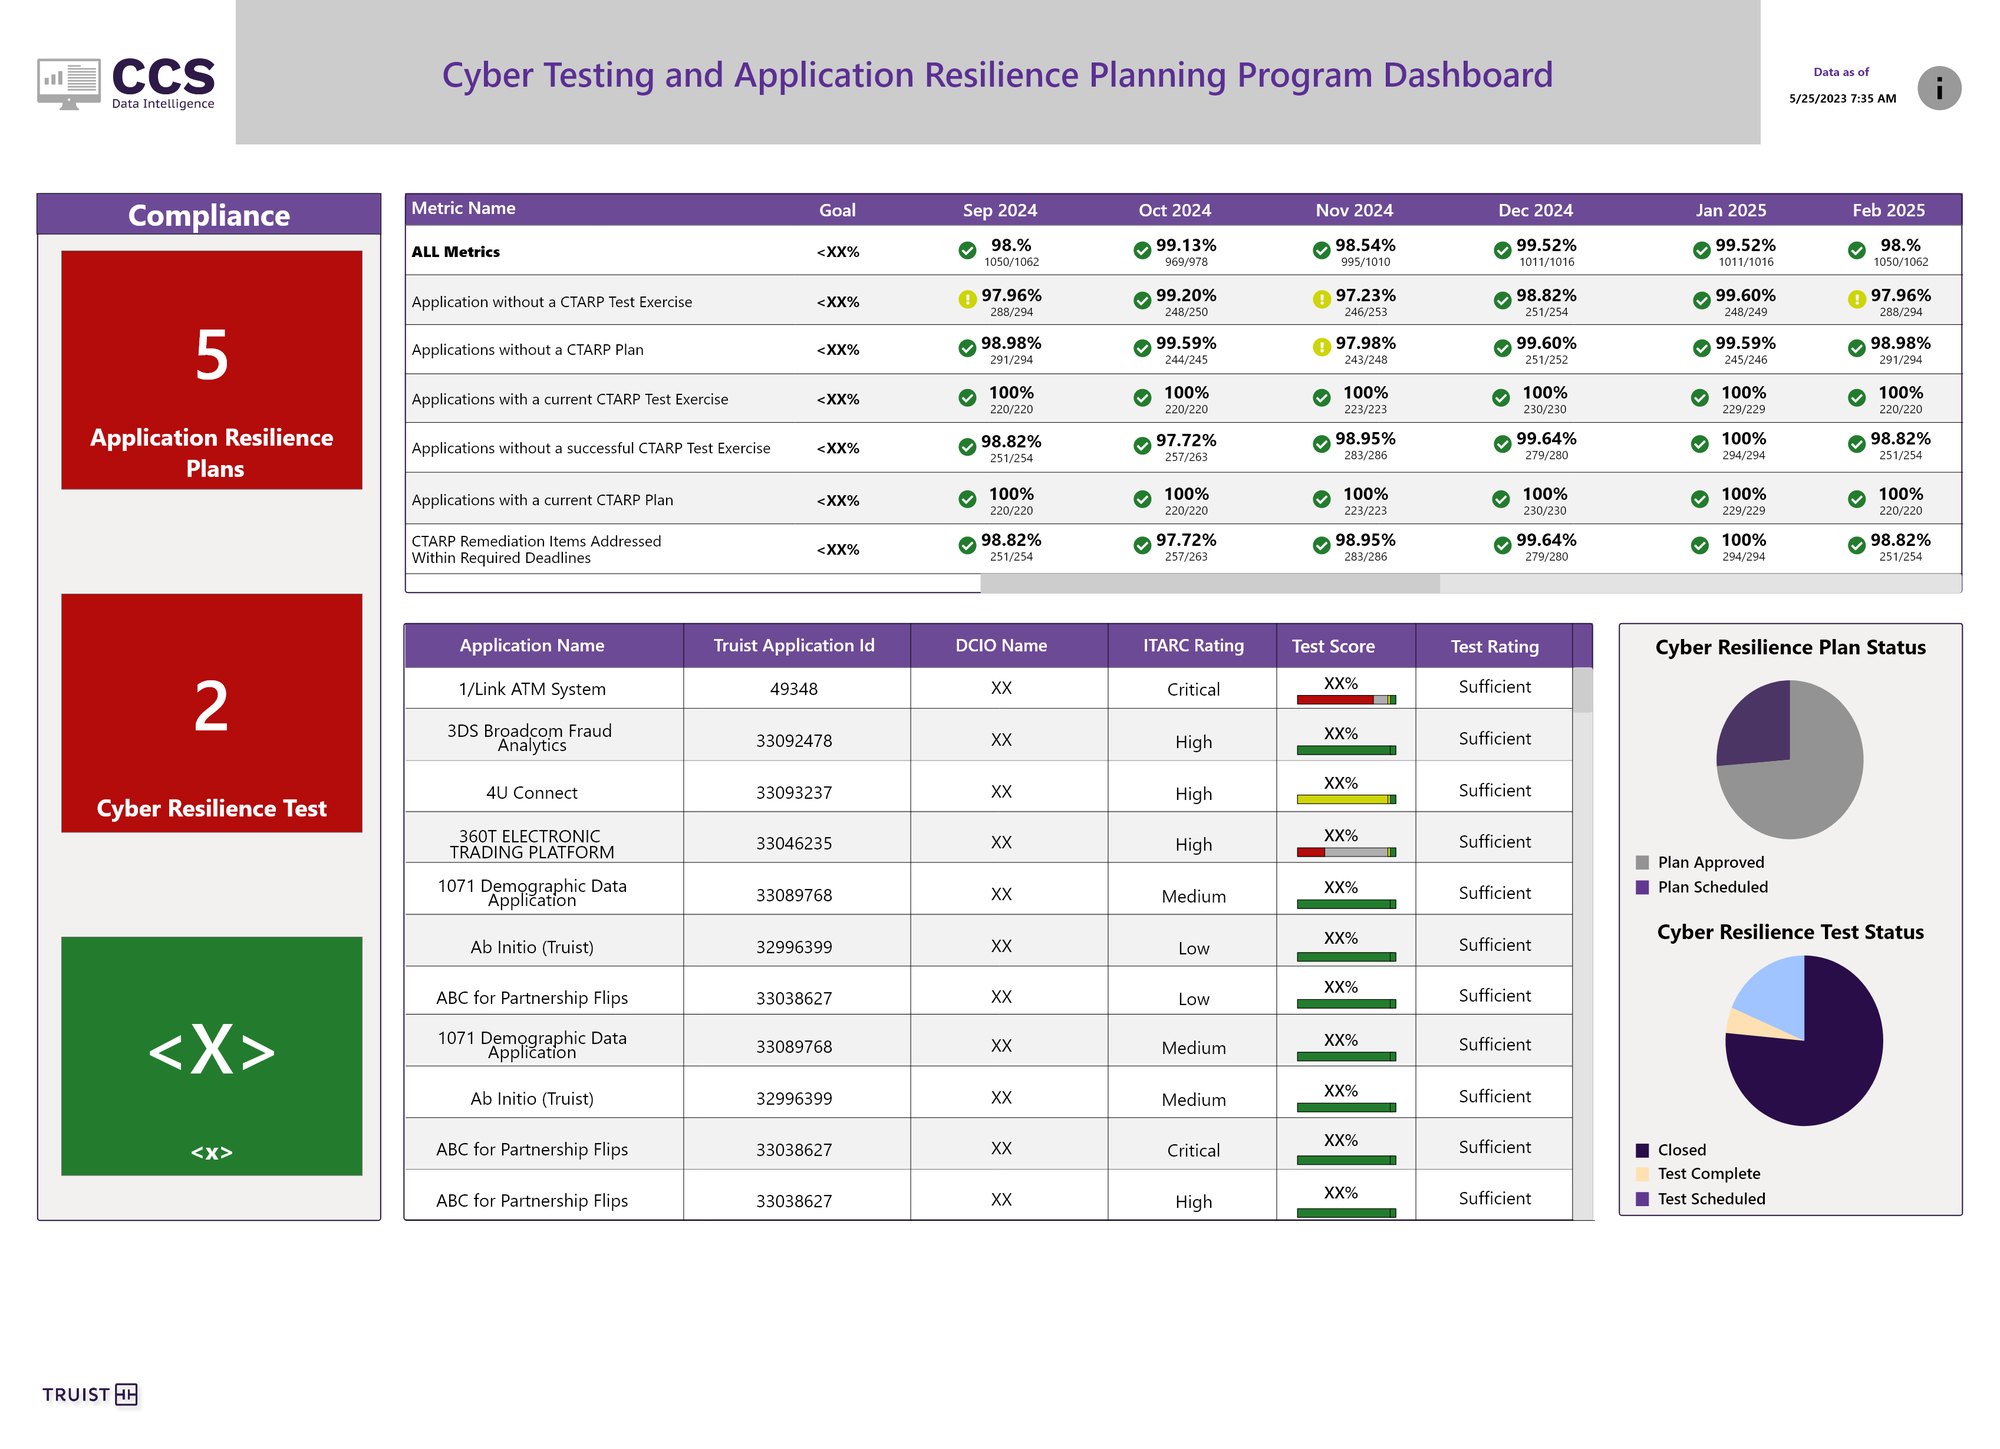
tableau · CTARP Program Dashboard

Monthly results against goal with check and warning icons, so status never relies on color alone.
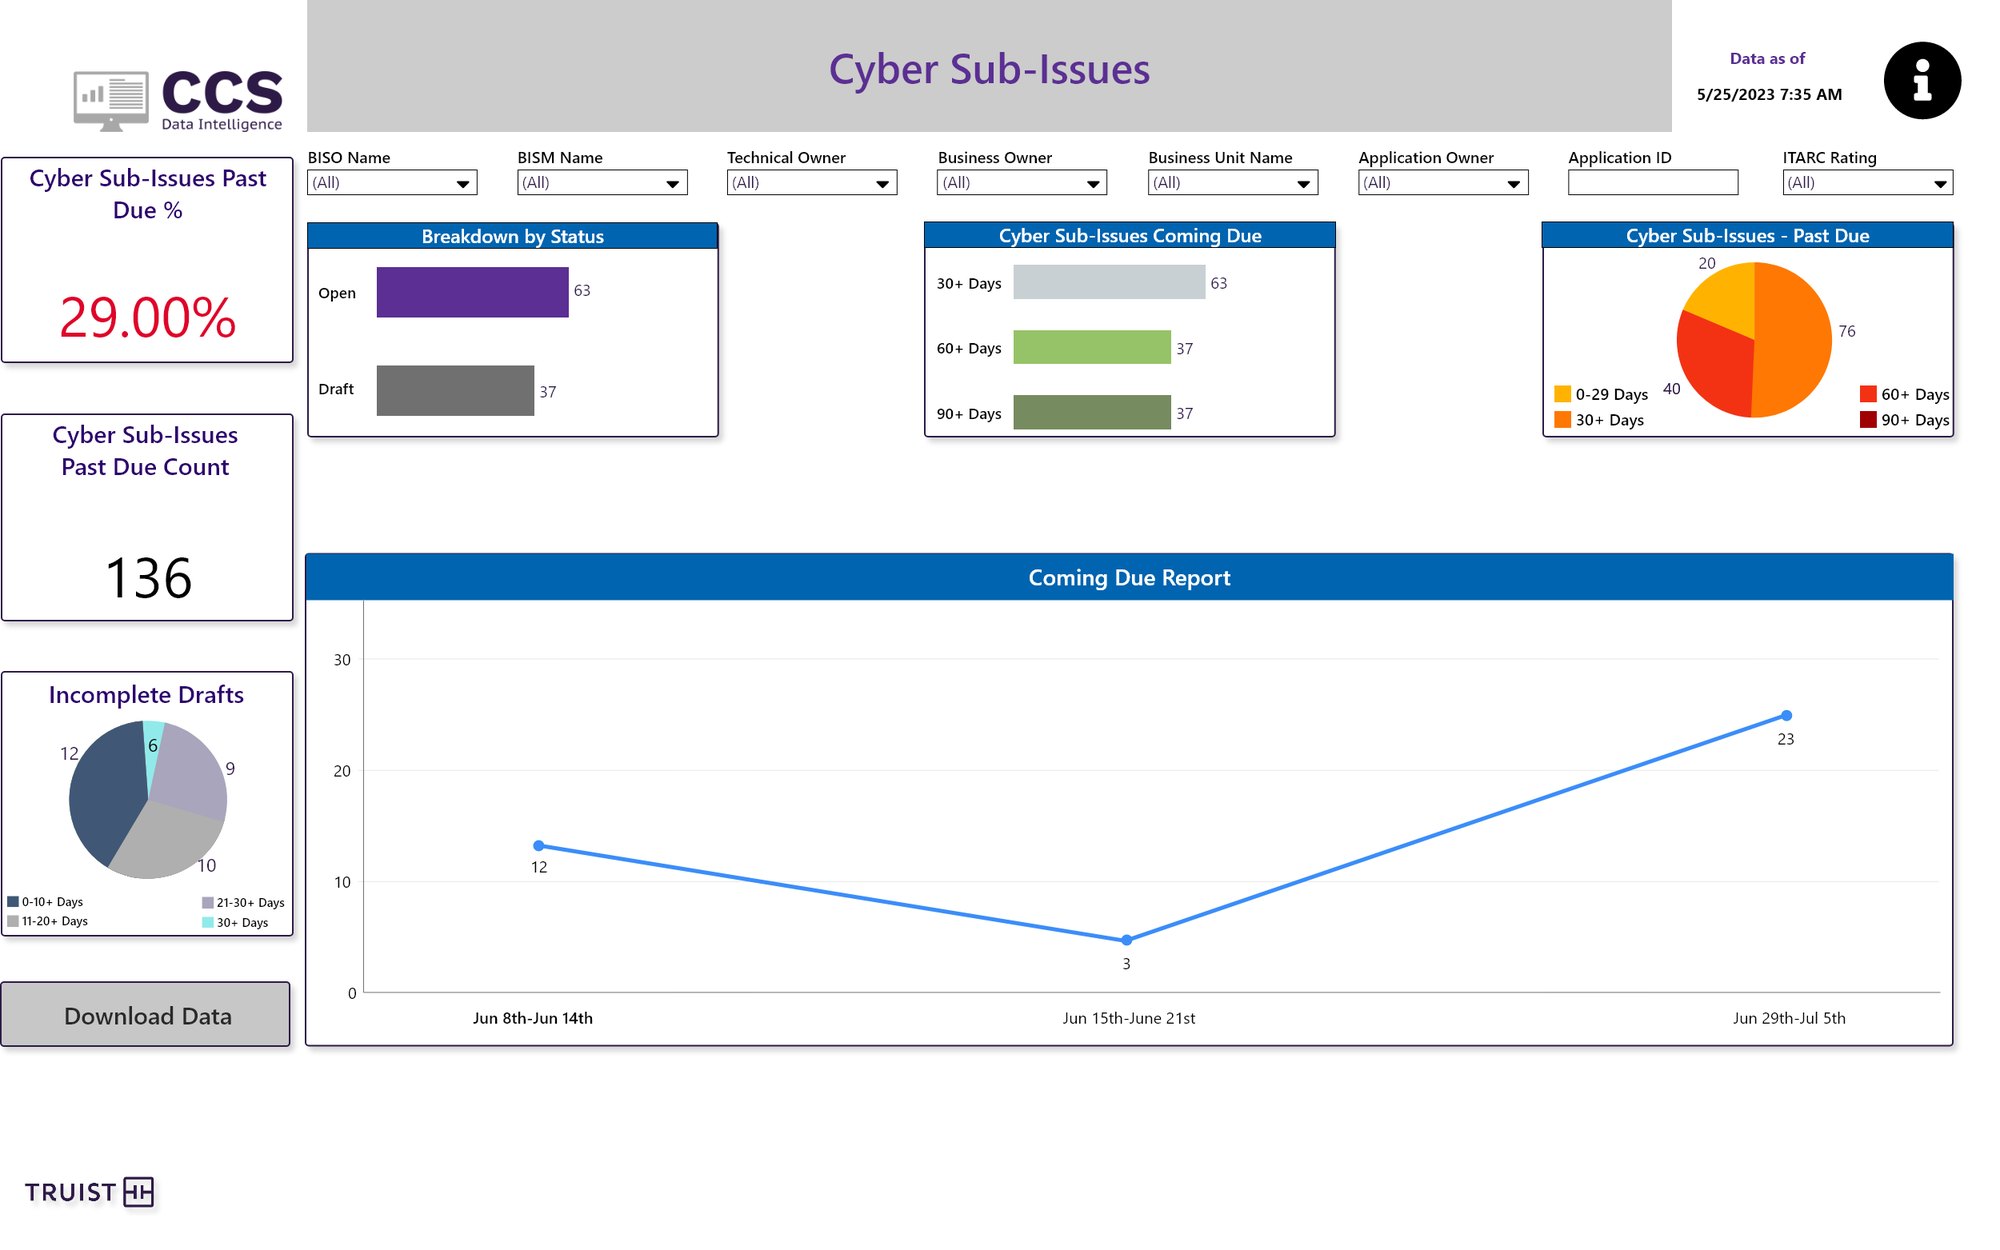
tableau · Cyber Sub-Issues

Past-due rate and count up top, then status, aging and a weekly coming-due report.

05Reflection

What I learned, and what I'd do next.

Takeaways

  • 01
    Feasibility is a design skillProving each idea in Tableau early meant no surprises at build time, and faster iteration overall.
  • 02
    A template is a productThe shared layout did more for consistency than any single dashboard. It cut inconsistencies in half.
  • 03
    Managing people is the jobClear requirements and steady stakeholder reviews were what got dashboards out on time.

If I took it further

  • →
    Lead with exceptionsShow what's out of compliance first, instead of 24 equal charts.
  • →
    Never rely on color alonePair red and green with icons and labels everywhere, like the resilience dashboard does.
  • →
    Plain-language summariesAn AI-written "what changed this month" note at the top of executive views.
How success was measured

The numbers that mattered

Incident response

20% faster, with clearer SOC and detection views.

Consistency

50% fewer inconsistencies across dashboards.

Speed

25% faster iteration and 25% shorter redesign timelines.

People

35% higher satisfaction and a 30% rise in phishing reporting.

IBM · Client: Truist · Cybersecurity dashboards

Truist Cyber Insights

I led UX for Truist's cybersecurity dashboards at IBM, where every design had to fit inside Tableau. Here I revisit that work without that limit: the same problem and the same real results, reimagined as a purpose-built product that shows people what needs action first.

My roleUX lead & client-facing owner: requirements, wireframes, Tableau proofs of concept, stakeholder management
TimeframeOriginal 2023 – 2026 · Revisit 2026
PlatformOriginal: Tableau · Revisit: a custom web product, free of Tableau's limits
AudienceCISO office, BISOs, DCIOs, SOC & CIRT analysts, risk teams
cyberinsights.truist / posture
TRUIST · CCSCyber Insights
PostureMetricsOperationsApplicationsRisk & controls
Data as of Jun 1, 2026 · 7:35 AM
Security posture
38 metrics out of compliance across 6 domains · 4 more than last month
Function AllPeriod Last 6 monthsExport
What changed this month

Workstations with unprotected privileged accounts is still the biggest gap at 80.8%, now 10 months out of compliance. TLS cipher compliance improved 3 points. Two Data Protection metrics turned red.

IAMOn track
Terminated users not disabled within SLA
0.08%Goal ≤ 0.10%
Data protection5 red
Production apps with unencrypted data at rest
99.4%Goal < 10%
Vulnerability mgmt3 red
Assets with non-compliant TLS versions
41.3%Goal ≤ 10%
Cyber operationsWatch
Mean time to detect a cyber event
1h 12mGoal ≤ 1h
Cyber technology2 red
Endpoint overall coverage
57.3%Goal ≥ 95%
OCISOOn track
High-priority apps not onboarded to access tool
4.4%Goal ≤ 5%
Longest out of compliancesorted by months out
MetricDomainCurrentGoalMonths out6-mo trend
614  HSM configuration complianceData protection31.2%≥ 90%13 months
502  Workstations with privileged accounts not protectedIAM80.8%≤ 5%10 months
555  Privileged user accounts not compliantIAM0.85%≤ 5%Back in range
556  Service account passwords not rotatedIAM30.2%≤ 5%New this month
NoteThe impact numbers come from the dashboards that shipped. Screens marked Redesign are my 2026 revisit, designed as a custom product without Tableau's limits and shown with sample data. Flip any of them to Original to see what shipped, or read the original case study →
00Overview

Security data was everywhere. Answers weren't.

Truist's cyber teams tracked hundreds of metrics across endpoints, applications, privileged access, data protection, incident response and resilience. The data lived in Tableau. As the IBM UX lead, I designed the dashboards as Tableau proofs of concept and managed Truist stakeholders so every dashboard reached engineering on time, with every requirement covered.

The shipped suite worked. It was consistent and it moved the numbers below. But Tableau set the rules: fixed chart types, limited layout control and no room for things like inline actions or plain-language summaries. So most screens showed everything with equal weight. This revisit asks what I'd design if the tool weren't the constraint. Same data, same audiences, and a sharper question on every screen: what should this person do next?

140+wireframes and dashboard views designed across the program
20%faster incident response once SOC views were in place
50%fewer inconsistencies across dashboards, thanks to one shared template
25%faster dashboard iteration
25%shorter redesign timelines
35%higher user satisfaction
30%increase in phishing reporting
01The challenge

Many audiences, many metrics, one source of truth.

A CISO wants to know where the bank is exposed. A BISO wants to know which of their apps are failing. A SOC analyst wants to know how fast threats are caught. Same data, very different questions.

01 / Equal weight

Everything looks important

Two dozen charts with the same size and style make it hard to spot the three that matter.

02 / Color only

Red and green carry the meaning

Status often depended on color alone, which fails for color-blind users and in printed reports.

03 / Dead ends

Status without a next step

Dashboards said what was wrong, but not who owns it, how long it's been wrong or what to do about it.

Objective

Keep the data and audiences of the original, but lift the Tableau constraint. Design each key screen as a purpose-built product where the most urgent item is the first thing you see.

How might we

How might we turn every dashboard from a report people read into a to-do list people act on?

02Principles

Four rules, no tool limits.

Without Tableau's constraints, I could design from what people need instead of what the tool allows. Every redesigned screen follows the same four rules. Together, they turn a wall of charts into a clear set of priorities.

Exceptions first

Sort by what's broken and how long it's been broken. Healthy metrics collapse into a summary.

Never color alone

Every status pairs color with an icon and a word: In range, At risk, Out.

Owner and next step

Each problem shows who owns it and one clear action, like Open queue or Share with owner.

A plain-language summary

A short "what changed" note at the top of executive views, so leaders get the story before the charts.

03The redesign

Same data. Clearer priorities.

Five key dashboards, redesigned as if I were building them from scratch, with no Tableau limits. Use the toggle on each one to compare with the original.

03.1 — Security posture

From 24 charts to one story.

The CISO Operational Dashboard showed six domains with four charts each, all at the same weight. The redesign gives each domain one headline metric against its goal, then lists the metrics that have been out of compliance the longest.

cyberinsights.truist / posture
TRUIST · CCSCyber Insights
PostureMetricsOperationsApplicationsRisk & controls
Data as of Jun 1, 2026 · 7:35 AM
Security posture
38 metrics out of compliance across 6 domains · 4 more than last month
Function AllPeriod Last 6 monthsExport
What changed this month

Workstations with unprotected privileged accounts is still the biggest gap at 80.8%, now 10 months out of compliance. TLS cipher compliance improved 3 points. Two Data Protection metrics turned red.

IAMOn track
Terminated users not disabled within SLA
0.08%Goal ≤ 0.10%
Data protection5 red
Production apps with unencrypted data at rest
99.4%Goal < 10%
Vulnerability mgmt3 red
Assets with non-compliant TLS versions
41.3%Goal ≤ 10%
Cyber operationsWatch
Mean time to detect a cyber event
1h 12mGoal ≤ 1h
Cyber technology2 red
Endpoint overall coverage
57.3%Goal ≥ 95%
OCISOOn track
High-priority apps not onboarded to access tool
4.4%Goal ≤ 5%
Longest out of compliancesorted by months out
MetricDomainCurrentGoalMonths out6-mo trend
614  HSM configuration complianceData protection31.2%≥ 90%13 months
502  Workstations with privileged accounts not protectedIAM80.8%≤ 5%10 months
555  Privileged user accounts not compliantIAM0.85%≤ 5%Back in range
556  Service account passwords not rotatedIAM30.2%≤ 5%New this month
tableau · CISO Operational Dashboard
Before→AfterGoal on every number

Each headline sits on a meter with the goal marked, so "good" never needs explaining.

Before→AfterA summary up top

A short note says what changed this month before anyone reads a chart.

Before→AfterDuration as priority

"Months out of compliance" moves from a column to the main sort order.

03.2 — Metric register

A heatmap people can actually read.

The CCS Metric Summary was a dense grid of red, yellow and green cells. The register keeps the same rows and business areas but adds a status mix bar, trend lines and symbols inside each cell, so it reads the same in grayscale.

cyberinsights.truist / metrics
TRUIST · CCSCyber Insights
PostureMetricsOperationsApplicationsRisk & controls
Data as of Jun 1, 2026 · 7:35 AM
Metric register
103 metrics · goal, status, trend and business-area breakdown in one row
Function AllOwner AllThreshold All
Status mix103 metrics
Out of compliance 38At risk 19In range 23In review 9Refining 14
MetricGoalJulStatus6-mo trendMo. out
EPWCSBBEFSCTOTEMPOEDACCS
Privileged access management
502  Workstations with privileged accounts not protected≤ 5%80.8%Out10
×××××××
505  Servers with privileged accounts not protected≤ 5%1.2%In range–
✓✓–✓✓✓✓
556  Distributed service account passwords not rotated≤ 5%30.2%Out–
–!✓–✓✓✓
Data protection
611  Assets with non-compliant TLS versions & ciphers≤ 10%41.3%Out–
–××××××
612  Digital certificates in compliance≥ 95%96.4%In range–
✓✓✓✓✓✓✓
613  SSH keys managed by cryptographic services≥ 90%40.0%At risk–
!!!!!!!
614  HSM configuration compliance≥ 90%31.2%Out13
!!!!!!!
655  Workstations without DLP endpoint agent≤ 10%99.4%Out1
×–✓××✓–
tableau · CCS Metric Summary
Before→AfterSymbols in every cell

✓, ! and × sit inside the colored cells, so status survives color blindness and printing.

Before→AfterTrend in the row

A six-month line next to each value shows whether a red metric is getting better or worse.

Before→AfterMix at a glance

A single stacked bar replaces the pie chart for the overall status split.

03.3 — SOC & CIRT

Response times with a target.

The original showed case counts and mean times, but no targets. The redesign puts every mean time next to its target, compares all events with true positives in one chart and shows how old active cases are by severity.

cyberinsights.truist / operations / soc
TRUIST · CCSCyber Insights
PostureMetricsOperationsApplicationsRisk & controls
Data as of Jun 1, 2026 · 7:35 AM
SOC & CIRT
Cases, incidents and response times · May 2026
All casesAll incidentsTrue positivesBusiness unit All
Created cases
1,234+5 vs Apr
Active cases
567+5 vs Apr
Closed cases
890+15 vs Apr
Closure rate
80%−3 pts
Mean time to detect · MTTD
1h 12m
Target ≤ 1h 00mOver target
Mean time to acknowledge · MTTA
18m 40s
Target ≤ 30mOn target
Mean time to contain · MTTC
6h 42m
Target ≤ 8hOn target
Detection timeAll eventsTrue positives
0–30 min
210 / 200
31–60 min
160 / 155
1–4 hrs
20 / 128
4–8 hrs
400 / 20
8–24 hrs
400 / 18
Most real incidents are caught within an hour. The slow tail is mostly noise.
Active cases by severity<1d1–3d3–7d7d+
Critical24 active
High118 active
Medium263 active
Low162 active
1 critical case older than 7 daysOpen queue
tableau · SOC & CIRT Dashboard
Before→AfterTargets, not just times

"1h 12m" means nothing alone. "1h 12m, target 1h" tells the team to act.

Before→AfterTwo views merged

The separate detection-time dashboard becomes one paired chart: all events vs real incidents.

Before→AfterAging by severity

A critical case sitting for a week is the one thing a SOC lead needs to see.

03.4 — Application scorecard

23 rows become four groups and a to-do list.

Application Compliance listed 23 requirements as one long red and green table. The scorecard groups them by category, shows one overall score and pulls the riskiest failures into a "Fix first" list the owner can act on.

cyberinsights.truist / apps / APPID-8886
TRUIST · CCSCyber Insights
PostureMetricsOperationsApplicationsRisk & controls
Data as of Jun 1, 2026 · 7:35 AM
APPID-8886 · Infrastructure · Internal · IaaS
Active Directory (Enterprise)
ITARC CriticalIn productionClient facingNot internet facing
Owner DCIO · Enterprise TechShare with owner
10of 21
Passing requirements
11 failing · 2 not applicable
Fix firstby risk
DAST vulnerabilitiesCritical
Encryption at restCritical
WAF protectionHigh
Access onboardingHigh
Score trend6 months
+37 → 10 passing
Scanning6 of 8
SAST onboardingCompliant
SAST high-severity0 found
SAST overdue3 items
SAST scan frequencyJun 20
DAST onboardingCompliant
DAST scanAuthenticated
DAST vulnerabilities100 open
SCA scanWithin 90 days
Resilience2 of 4
BRIA completedMissing
Penetration testingWithin 12 mo
Cyber resilience planCurrent
Cyber resilience testNot run
Infrastructure1 of 6
On-prem baseline22% of 90%
Anti-virus45%
Endpoint complianceCompliant
WAF protectionNot protected
Encryption at restUnencrypted
Digital code signingNot signed
Access1 of 3 · 2 N/A
Access onboardingMissing
Federated authN/A
MFAN/A
Unauthorized grants0
Role attestationsOverdue
tableau · Application Compliance
Before→AfterGrouped by category

Scanning, access, infrastructure and resilience map to the teams that fix them.

Before→AfterOne score

"10 of 21 passing" replaces a pie chart with placeholder labels.

Before→AfterFix first

The riskiest failures rise to the top, with a button to share them with the owner.

03.5 — Risk & controls

The governance chain, made literal.

The original used seven circles as navigation and swapped the whole page for each one. The redesign turns them into a connected chain with monthly change, keeps InfoSec towers as tabs and shows remediation aging and the plan list together.

cyberinsights.truist / risk-controls / remediation
TRUIST · CCSCyber Insights
PostureMetricsOperationsApplicationsRisk & controls
Data as of Jun 1, 2026 · 7:35 AM
Risk & controls
Follow the chain from business process to remediation. Pick any step to filter the rest.
Business unit AllOwner All
All towersSecurity TechnologySecurity ProtectionSecurity OperationsOSICOIAMBISOSecurity Delivery
Processes5+3 in May
Risks7+4 in May
Controls8+2 in May
Findings4+1 in May
Remediation2−1 in May
Metrics4−1 in May
Policies4+1 in May
Coming due230 items
0–29 days
81
30+ days
63
60+ days
37
90+ days
37
120+ days
12
Past due136 items
0–29 days
20
30+ days
76
60+ days
40
76 items slipped past 30 days. Most sit with IAM and Security Operations.
Plan completionall towers
88%
of remediation plans complete
Up 4 pts since April
PlanRemediationTowerOwnerStatusDueAging
REM-1042Rotate shared service credentialsIAMIAM leadPast dueMar 2860+ days
REM-1057WAF coverage for client-facing appsSecurity ProtectionAppSec leadDue soonJun 140–29 days
REM-1063Encrypt production data storesSecurity TechnologyData leadOn trackAug 30—
REM-1071DLP agent rollout, wave 3Security OperationsEndpoint leadPast dueApr 3030+ days
tableau · PRC / Remediation
Before→AfterA visible chain

Process, risk, control, finding, remediation read left to right, the way auditors think.

Before→AfterBars, not a pie

Past-due aging as bars makes "76 items over 30 days" impossible to miss.

Before→AfterReal rows

Plan names, owners and due dates replace XX placeholders, so the table is useful on its own.

04Reflection

What I learned, and what I'd do next.

From the original

  • 01
    Feasibility is a design skillProving each dashboard in Tableau early meant no surprises at build time.
  • 02
    A template is a productOne shared layout did more for consistency than any single screen.
  • 03
    Managing people is the jobClear requirements and steady reviews got dashboards out on time.

From the revisit

  • →
    Priority beats completenessThe best dashboard isn't the one with every metric. It's the one that tells you where to start.
  • →
    Accessible by defaultIcons and labels on every status cost nothing and work for everyone.
  • →
    Design first, tool secondIn Tableau, the tool decided what was possible. Starting from the user's next step, then picking the technology, opens up summaries, inline actions and smarter layouts.
How success was measured · shipped version

The numbers that mattered

Incident response

20% faster, with clearer SOC and detection views.

Consistency

50% fewer inconsistencies across dashboards.

Speed

25% faster iteration and 25% shorter redesign timelines.

People

35% higher satisfaction and a 30% rise in phishing reporting.